Web Apps
Explore statistical concepts in an interactive way. Use the apps to construct graphs, obtain summary statistics, find probabilities, get confidence intervals or fit linear regression models. Take screenshots or download graphs of your data.
Exploratory Data Analysis
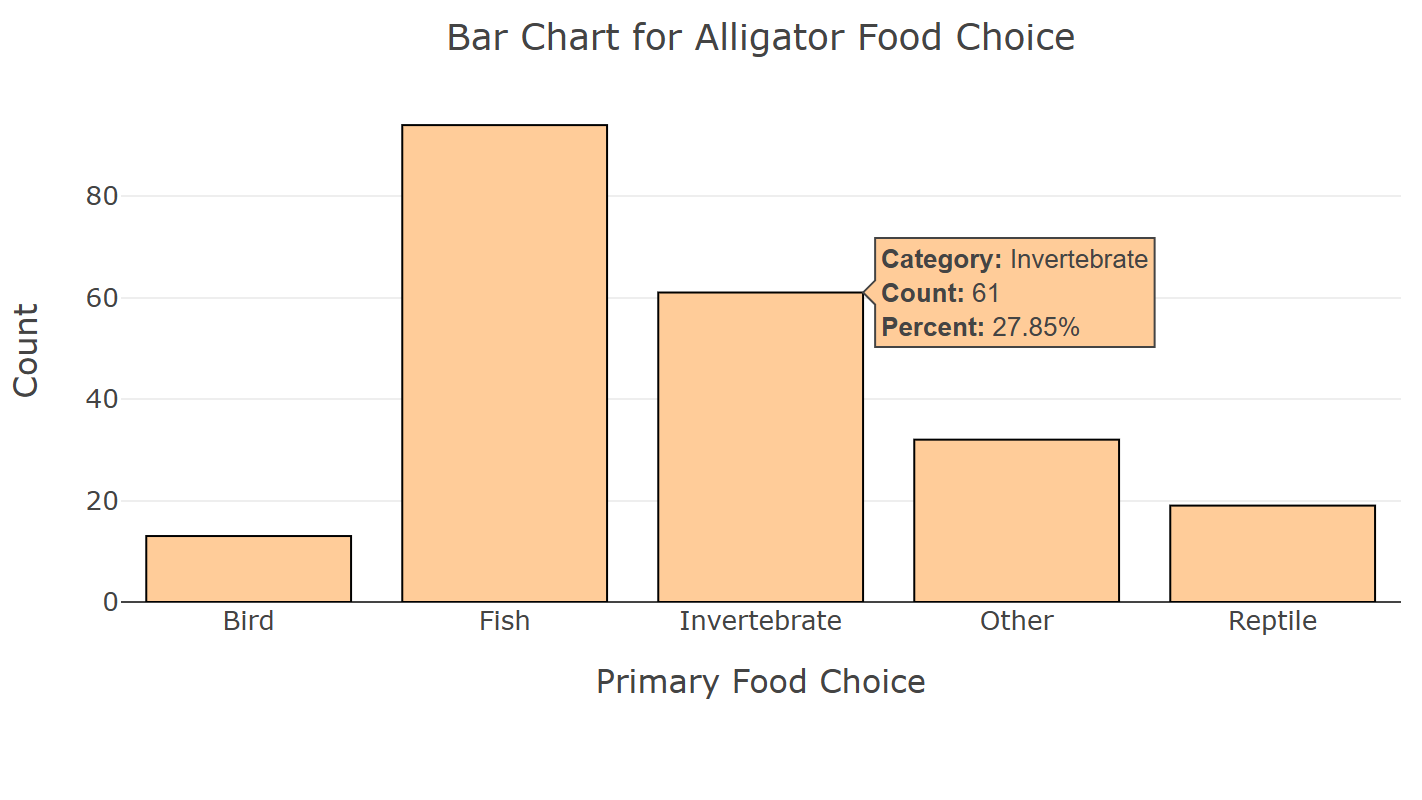
Explore Categorical Data
Construct frequency and contingency tables and bar graphs to explore distributions of categorical variables. For one or two variables. Use preloaded data or upload your own.
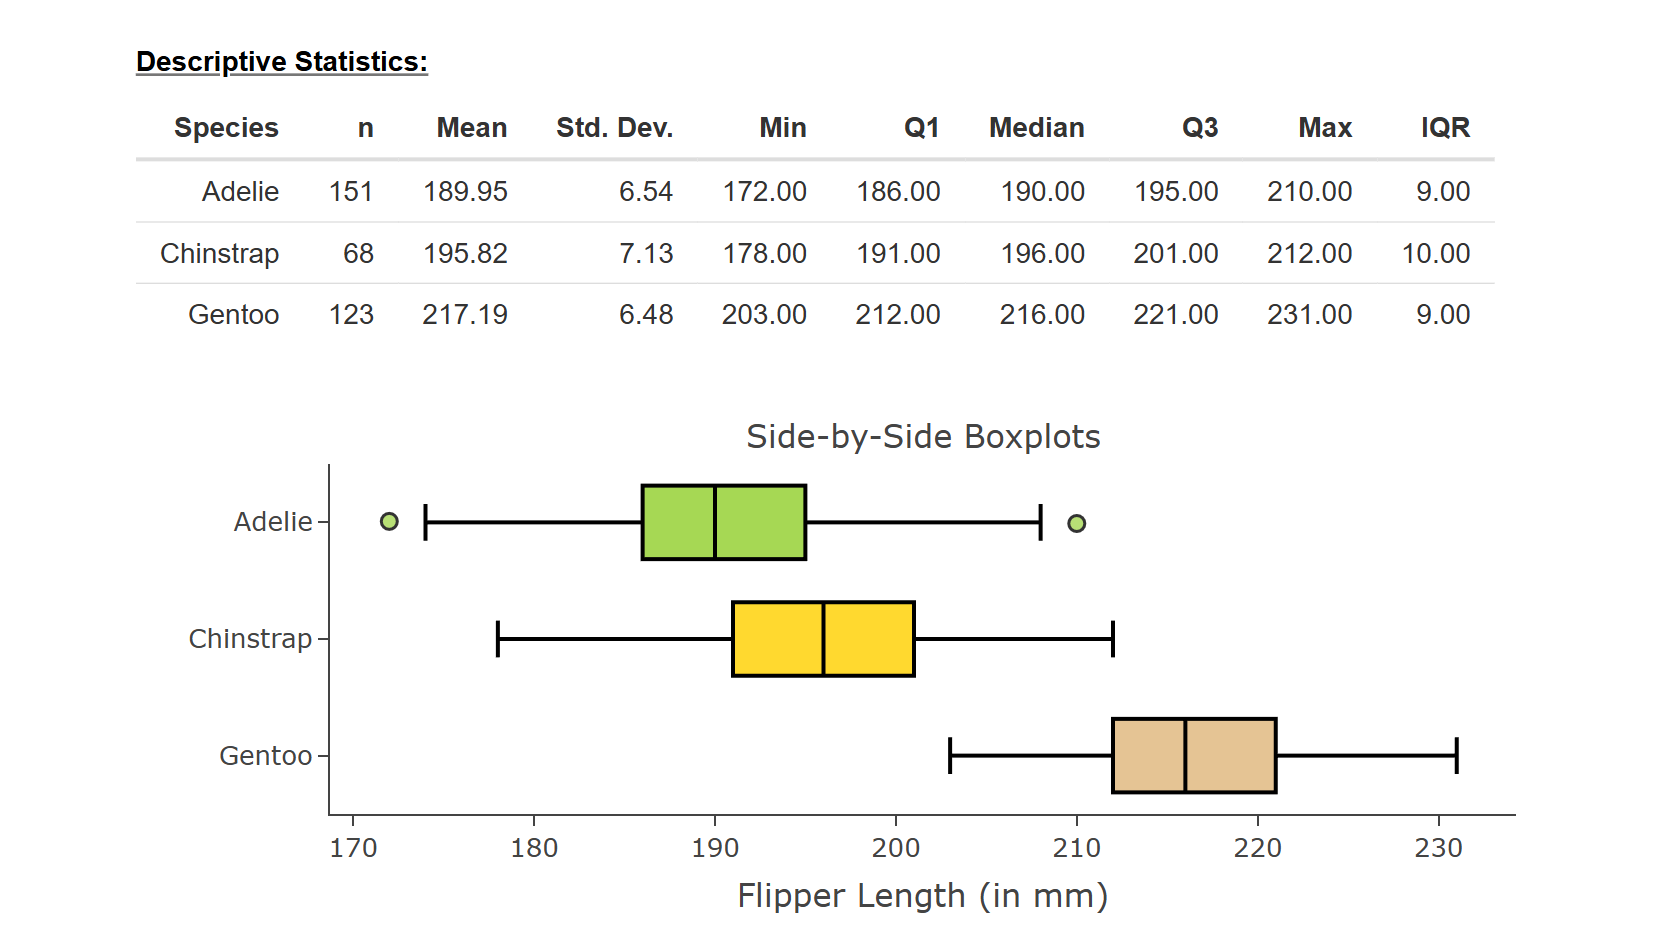
Explore Quantitative Data
Find summary statistics and construct interactive histograms, boxplots, dotplots or stem & leaf plots. For one, two, or more groups. Use preloaded data or upload your own.
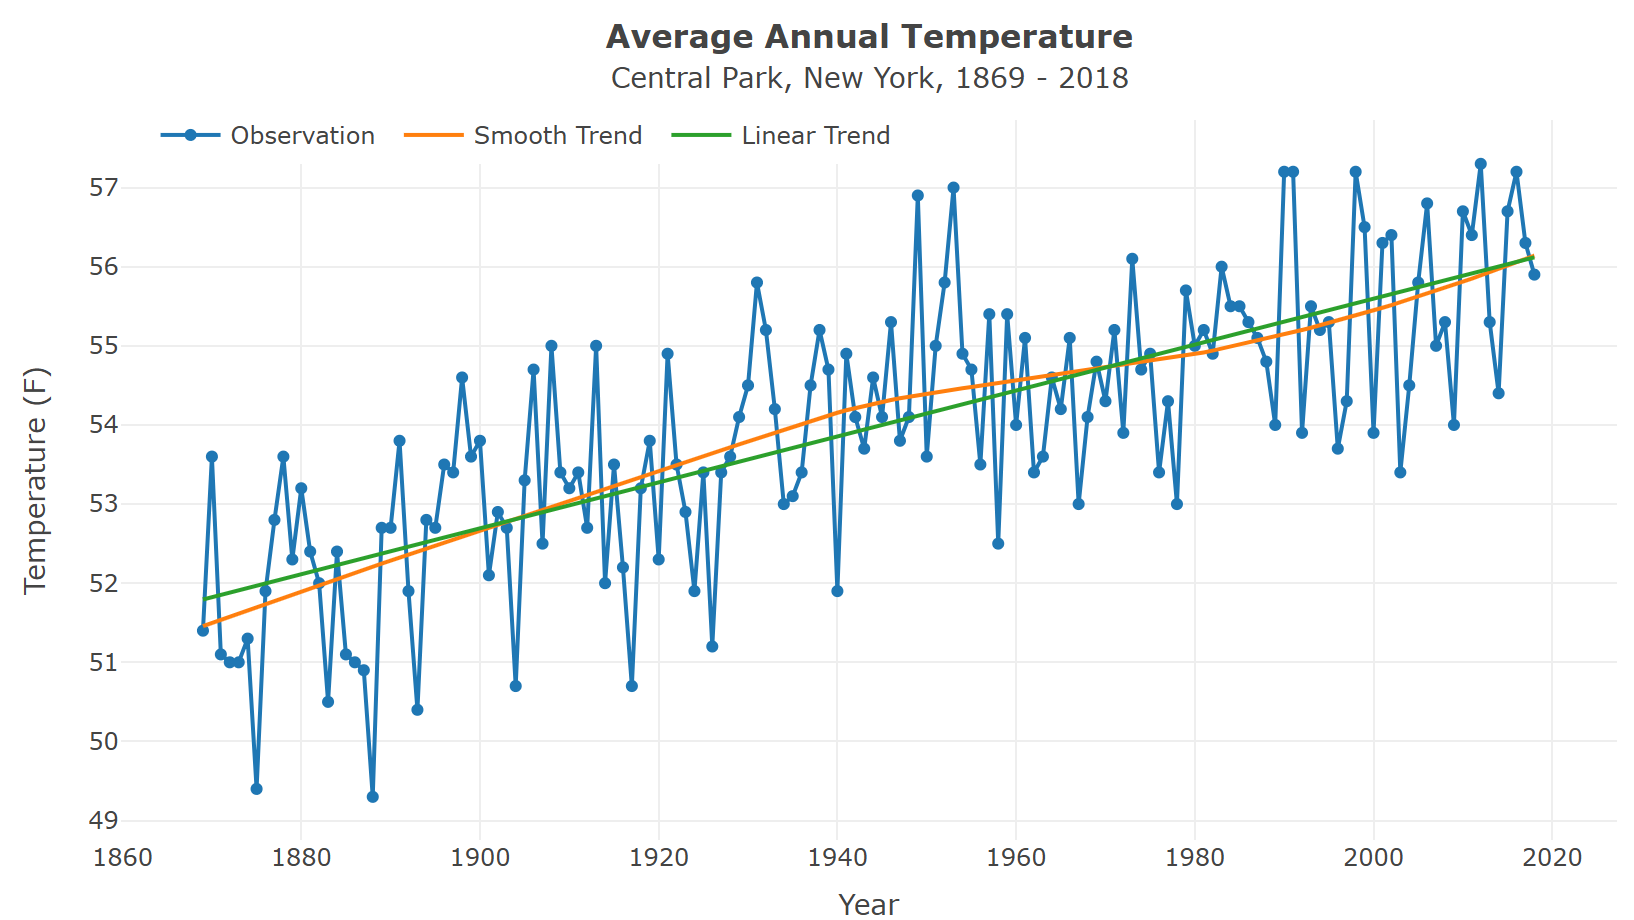
Time Series Plots
Plot a simple time series and add a smooth or linear trend. Use preloaded data or provide your own.
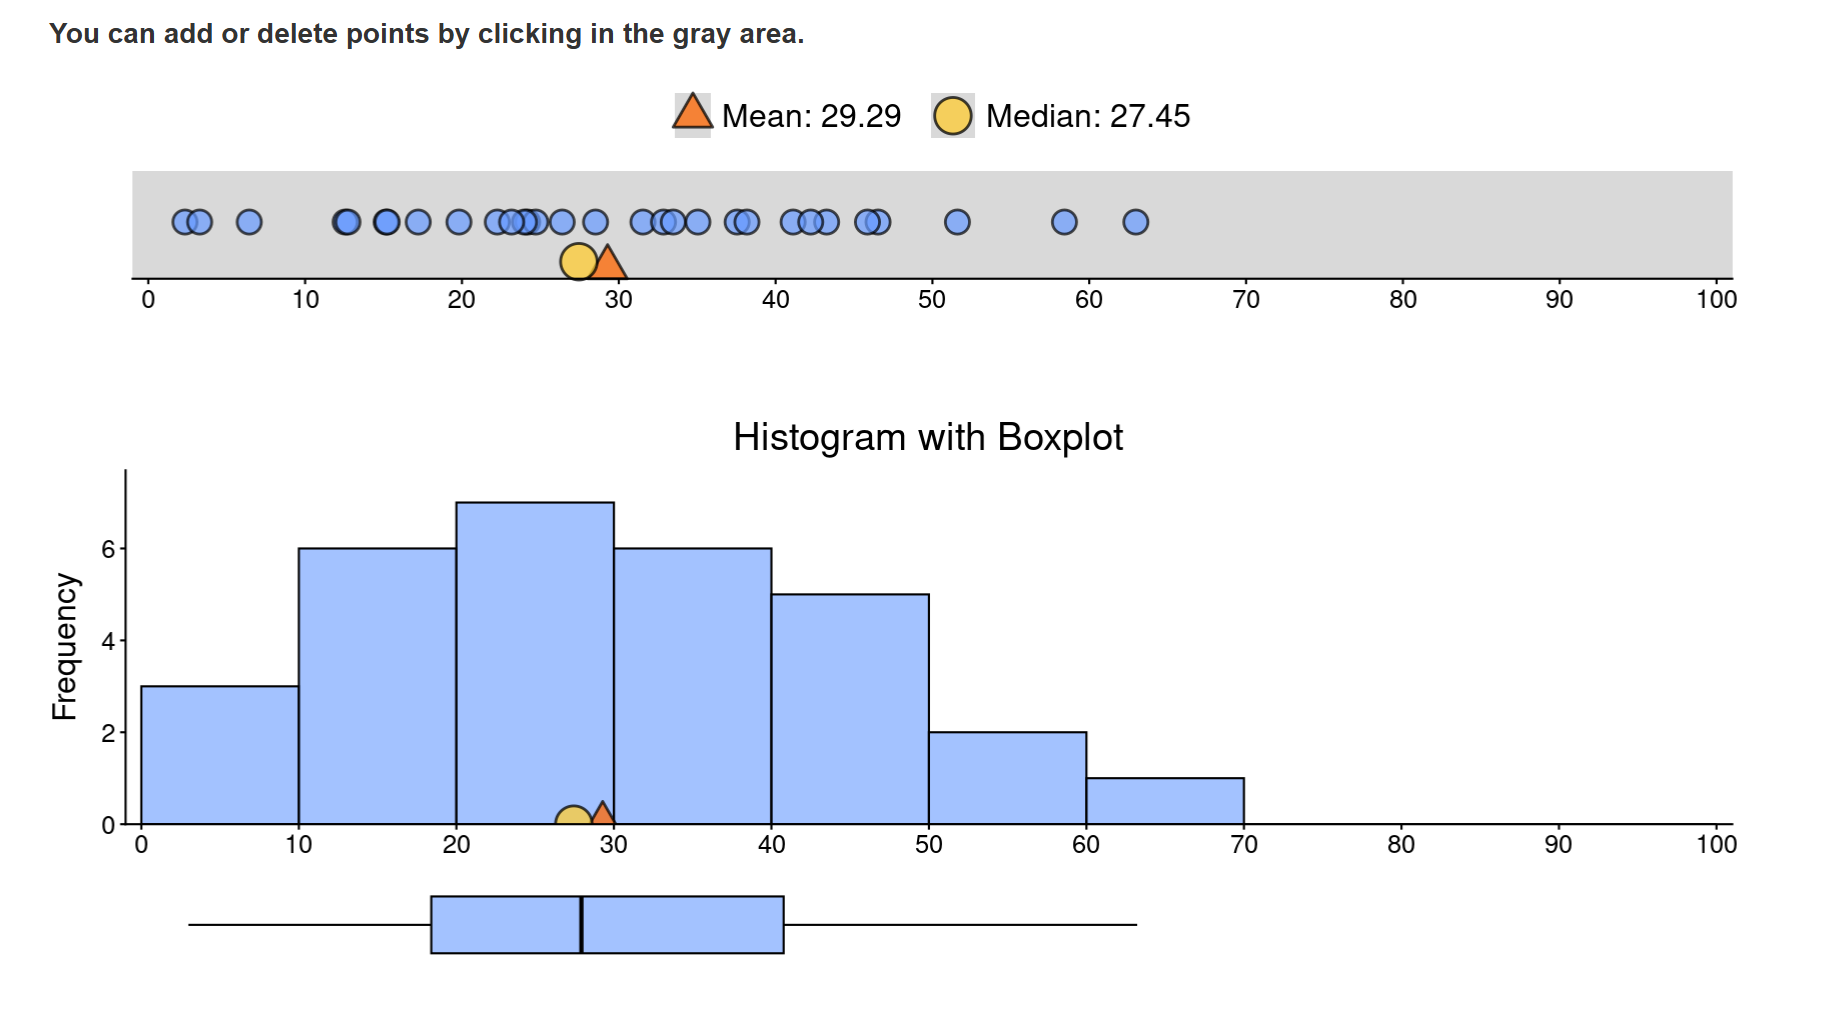
Mean vs. Median
Explore the relationship between the mean and median for data coming from a variety of distributions, or enter your own data.
Random Numbers
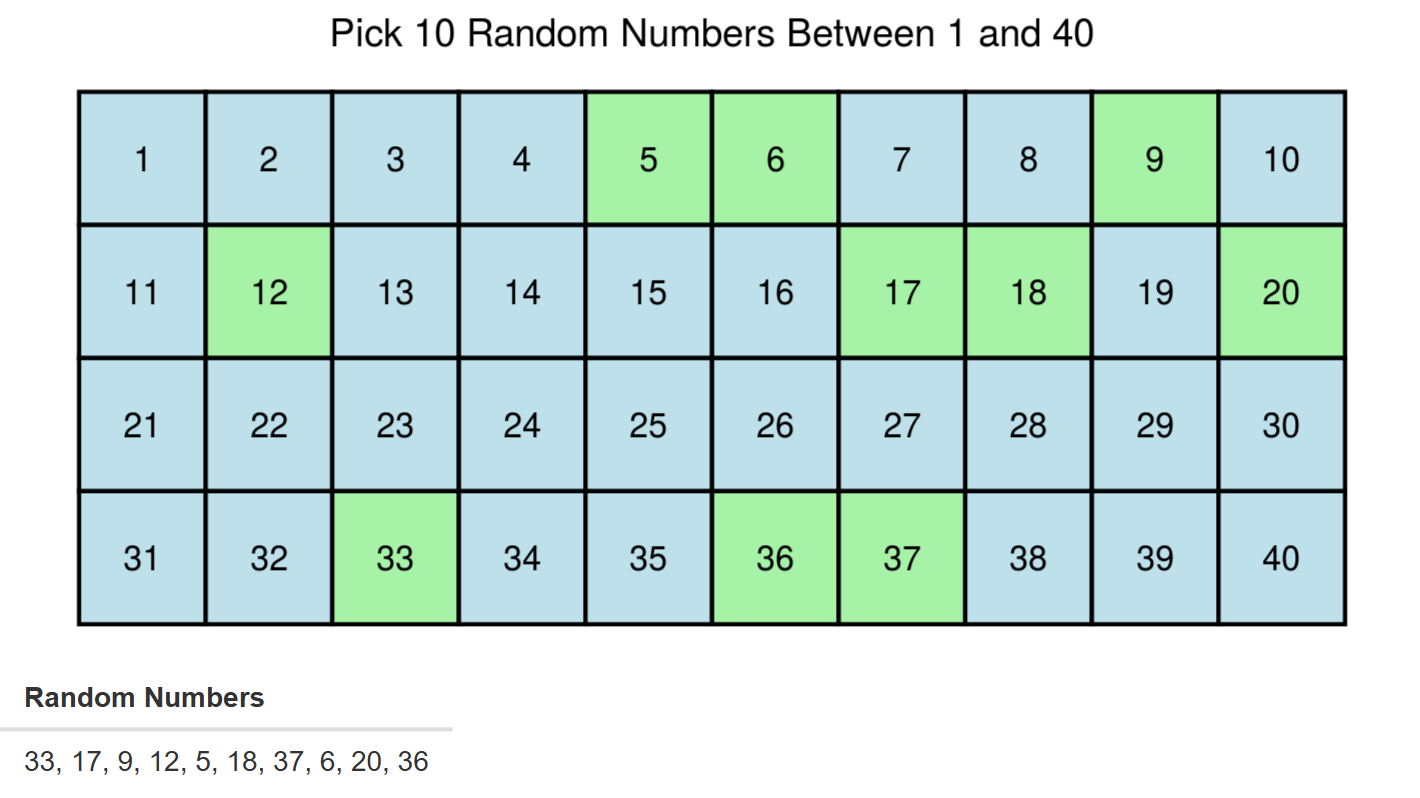
Generate random numbers or flips of a (biased) coin. Keep track of generated numbers with a bar chart.
Association, Correlation & Regression
Association Between Two Categorical Variables
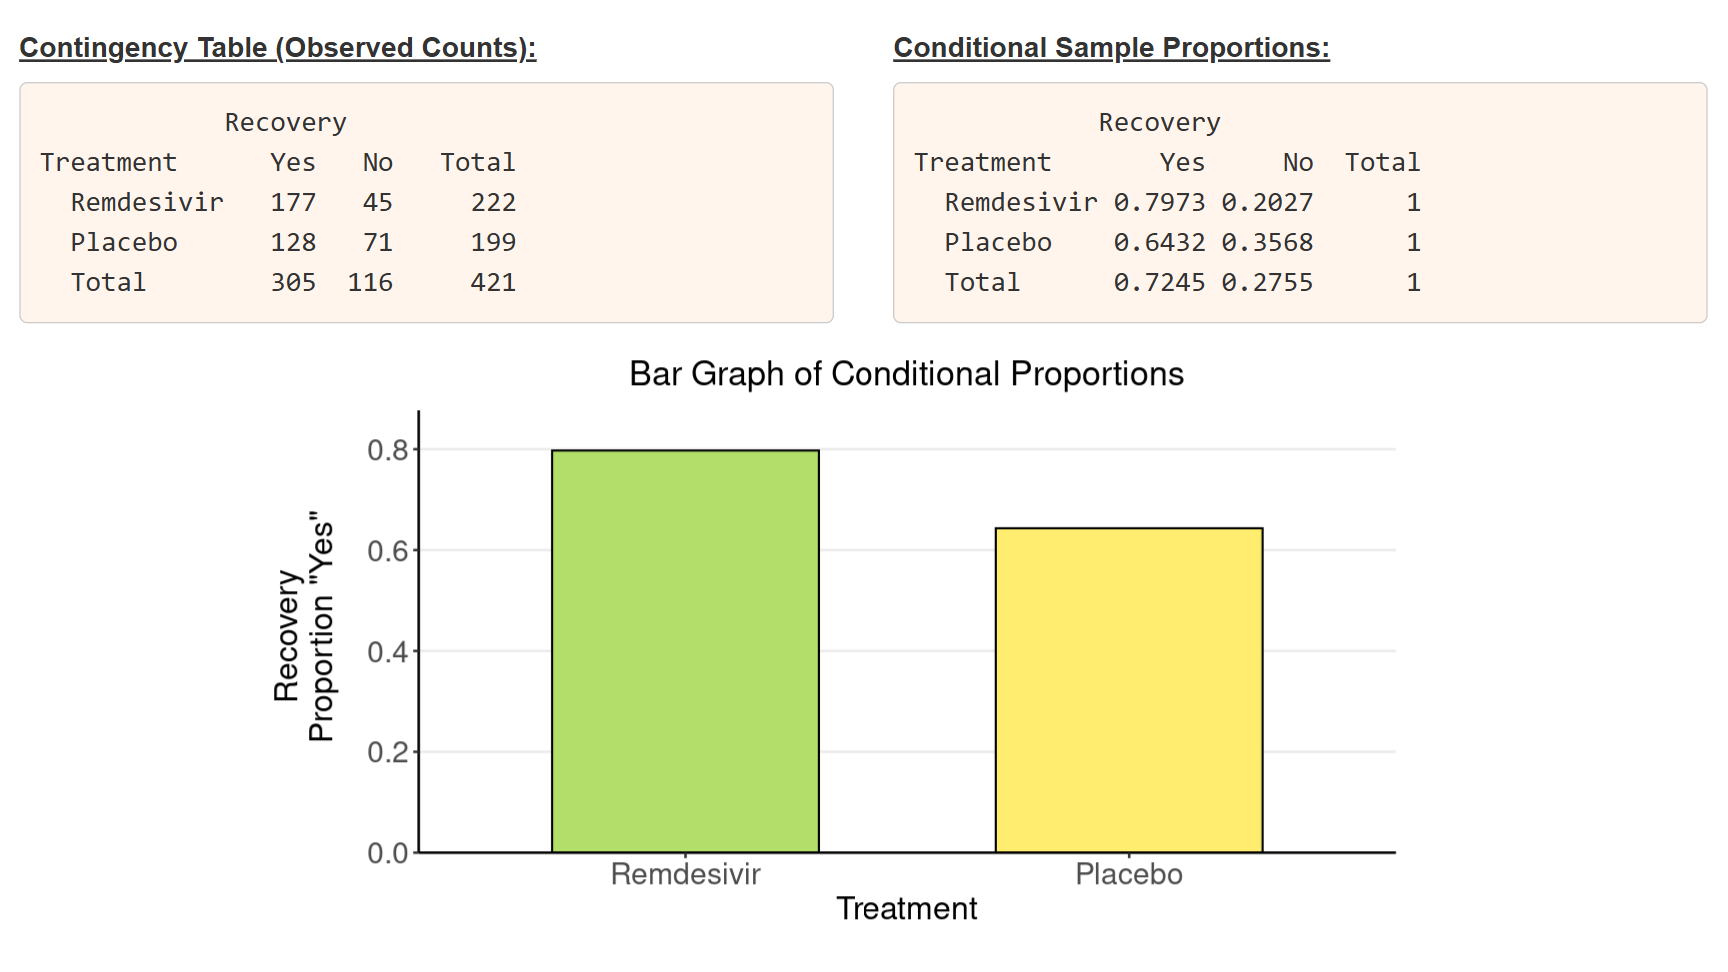
Construct 2 x 2 contingency tables, obtain conditional proportions and get a bar graph. Find the difference or ratio of proportions to describe the strength of the association. Build the sampling distribution of the difference or ratio via resampling. Use preloaded data or upload your own.
Scatterplots & Correlation
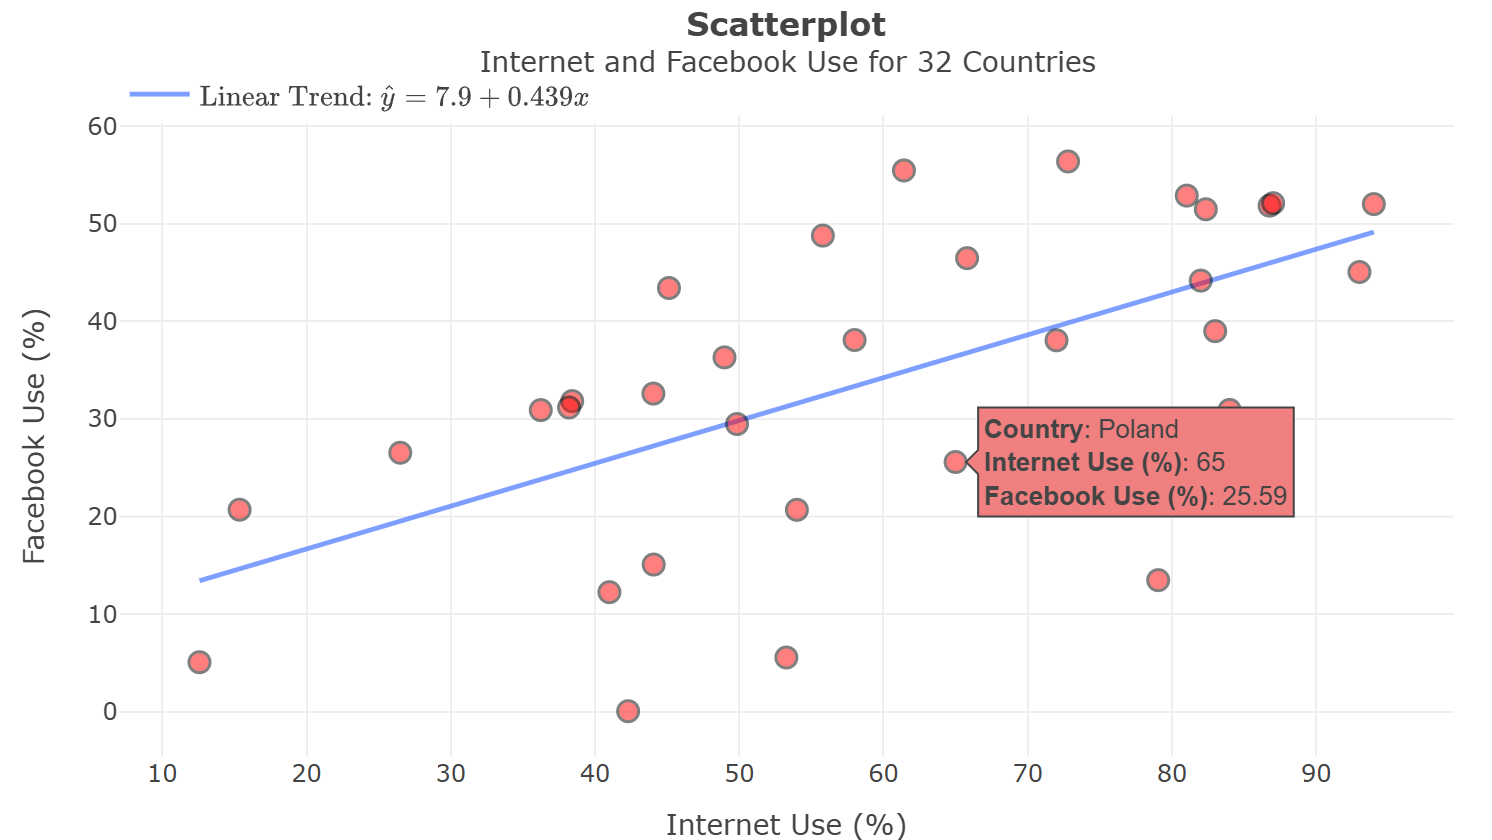
Construct interactive scatterplots, hover over points, move them around (or remove them) and overlay a smooth trend line. Find the correlation coefficient r and see if it is robust to outliers. Build the sampling distribution of the correlation coefficient via resampling. Use preloaded data or upload your own.
Guess the Correlation
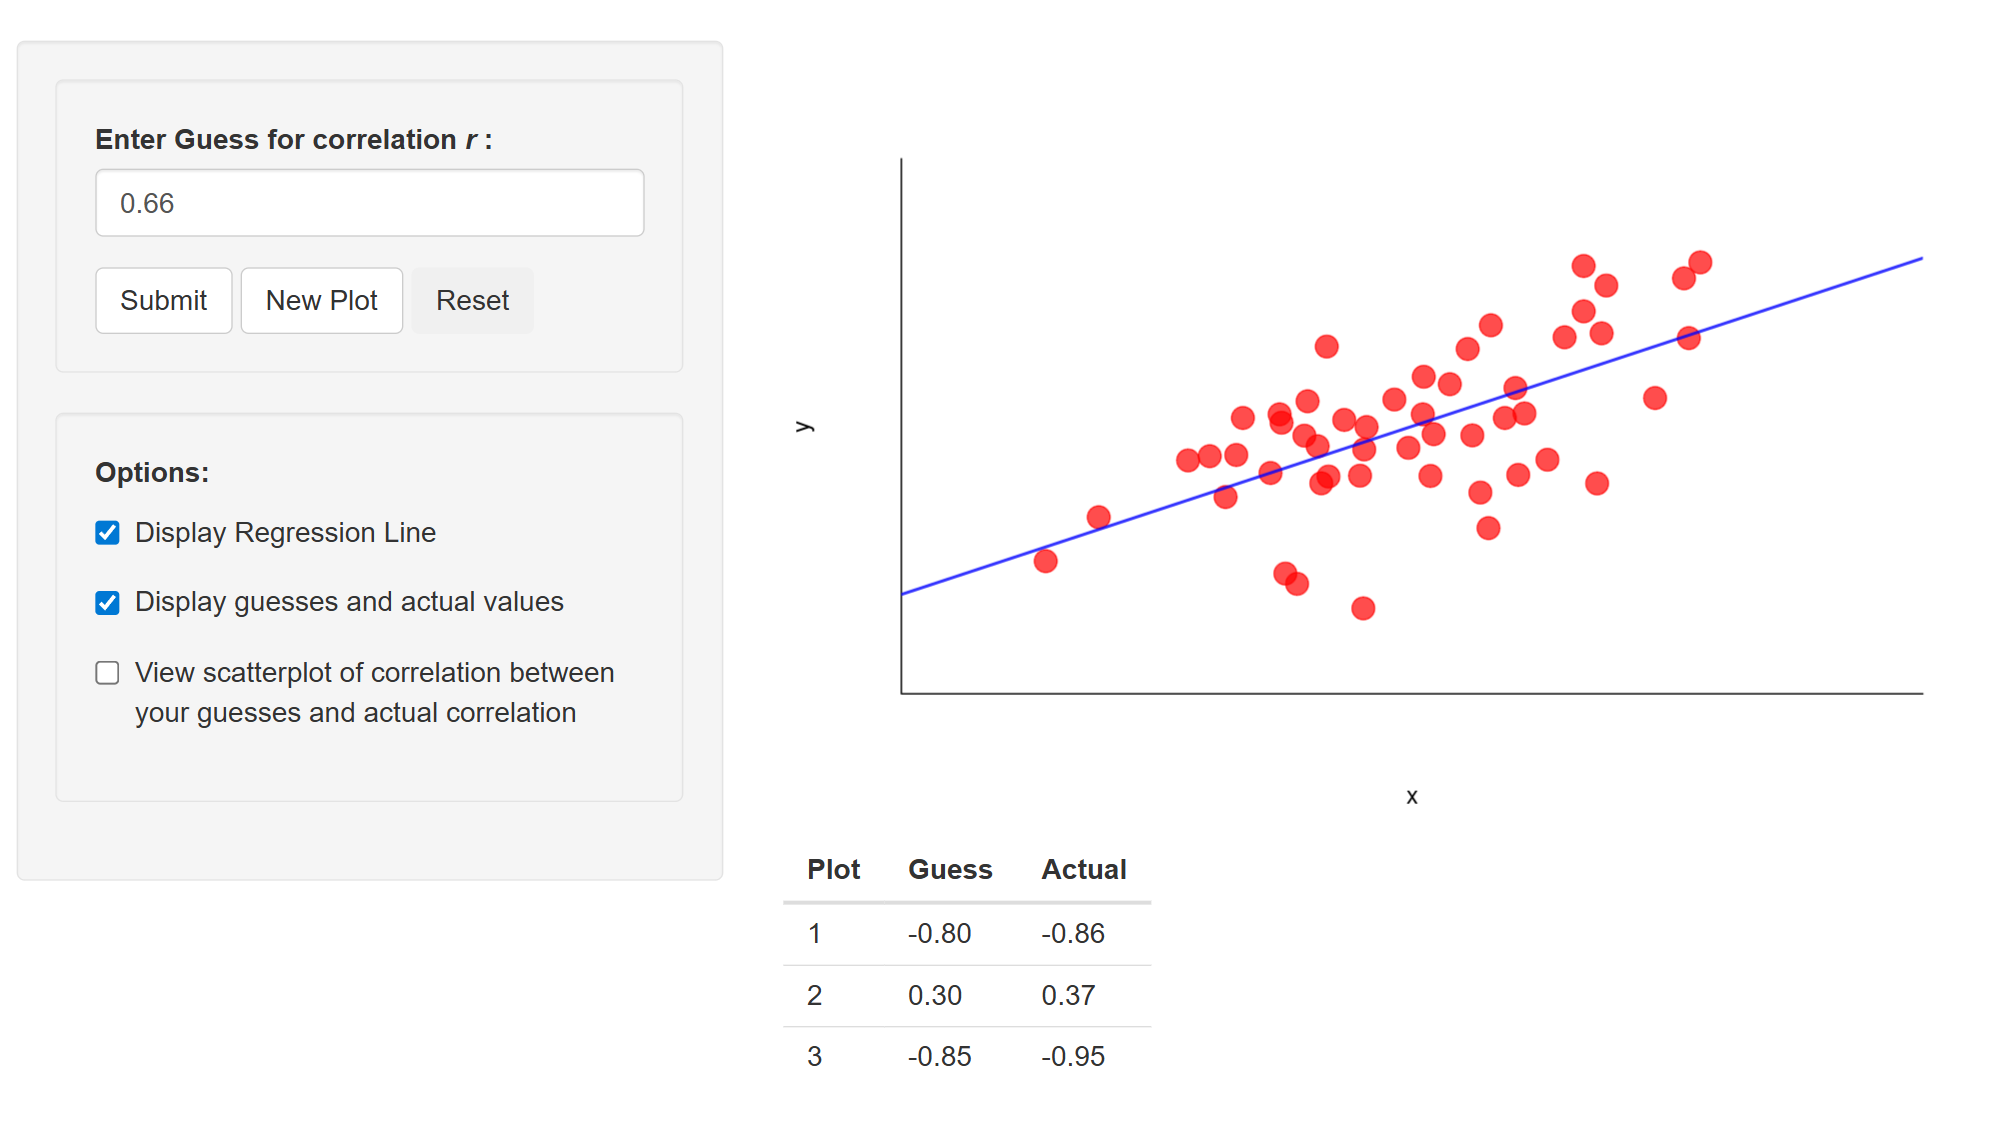
Randomly generate scatterplots to guess the correlation coefficient r. Optionally, display the regression line. How do your guesses correlate with the actual values?
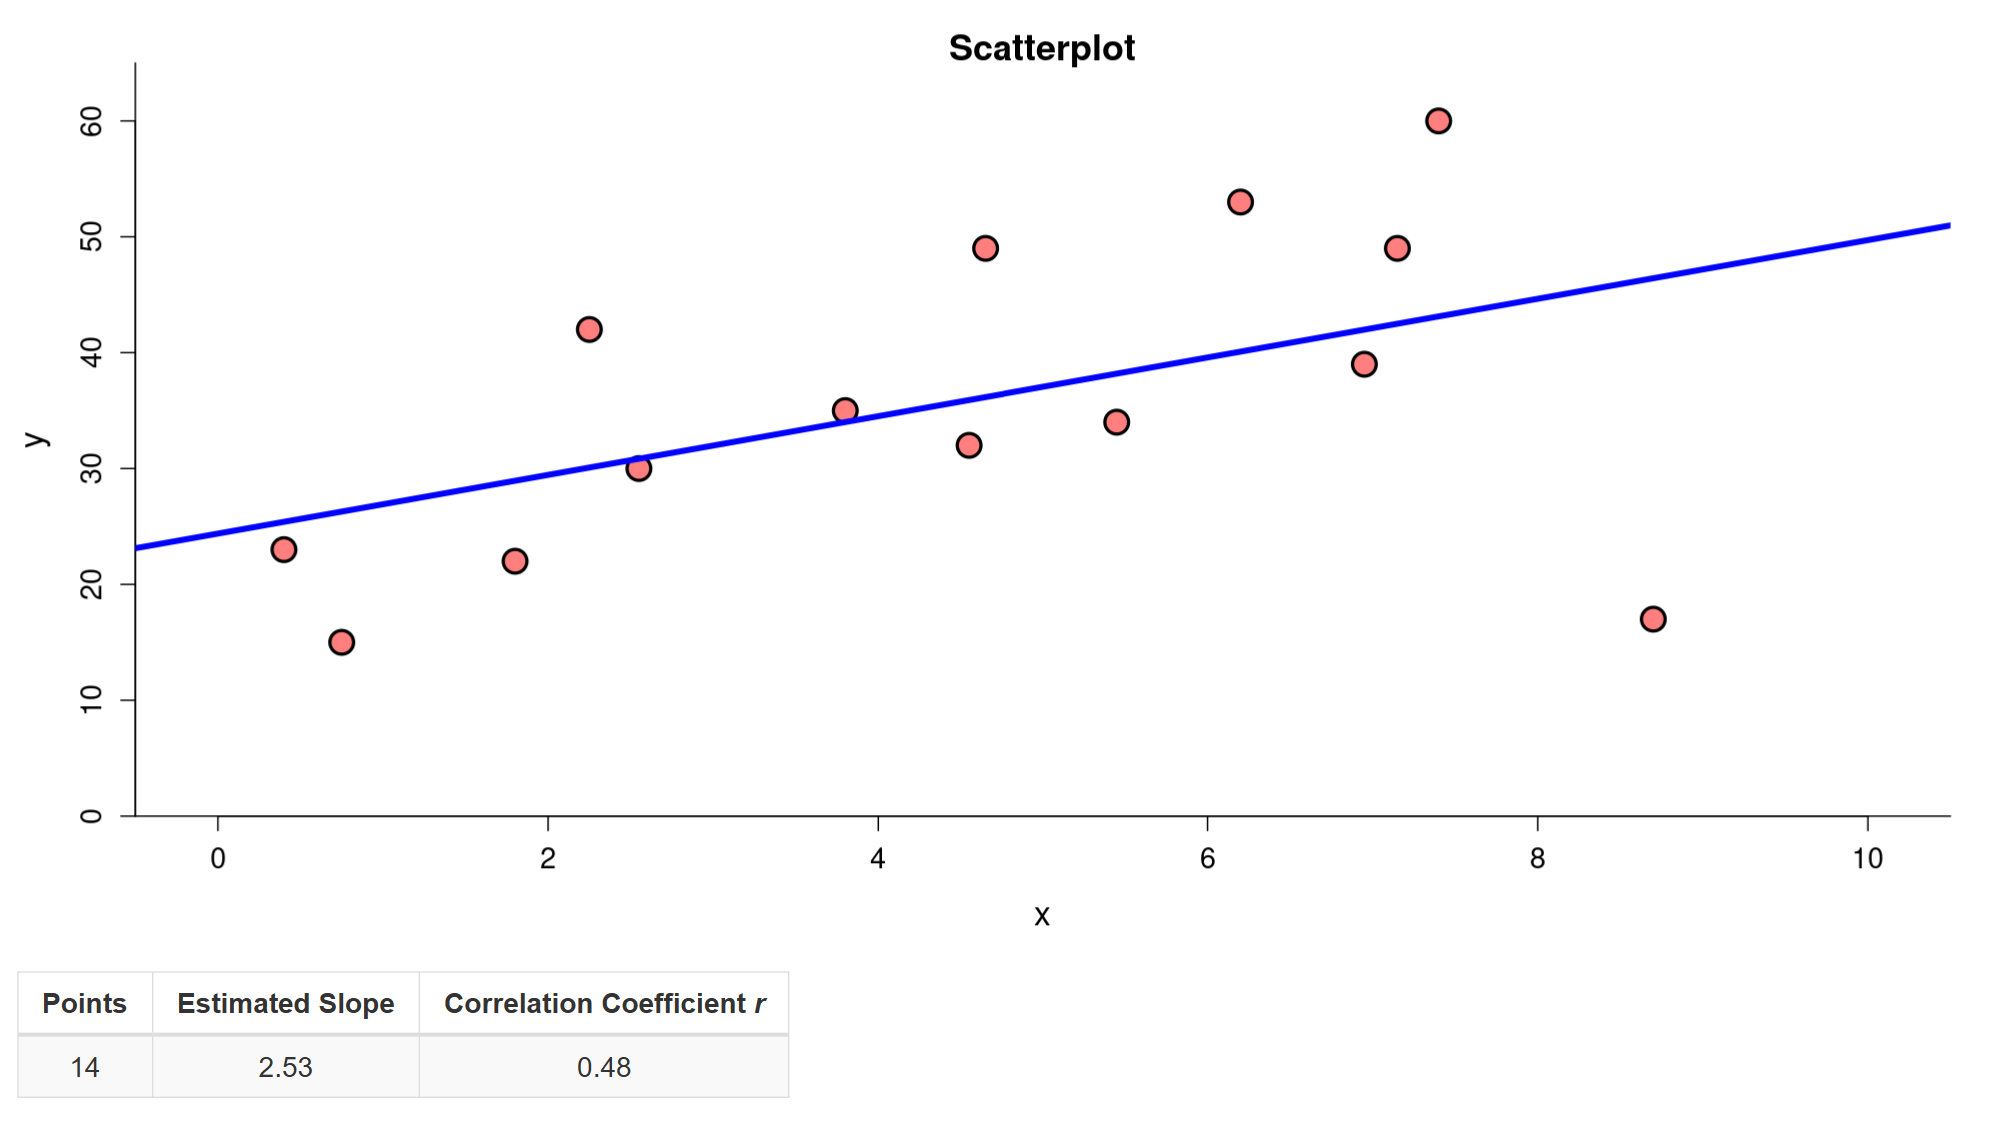
Explore Linear Regression
Create scatterplots from scratch by clicking in an empty plot to add or remove points. Investigate the effect of outliers on the correlation coefficient or regression line. Simulate linear or non-linear relationships.
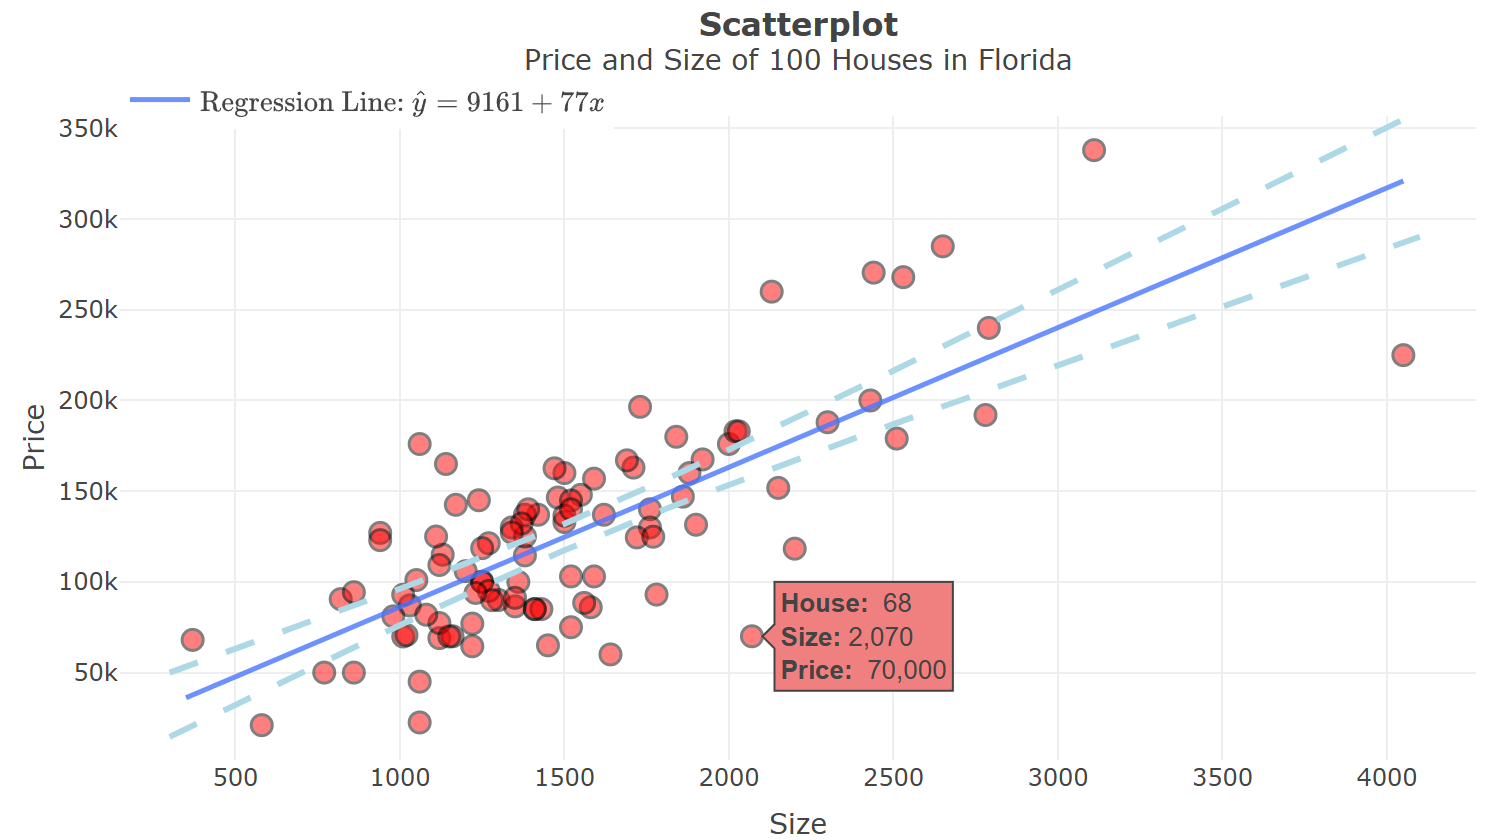
Linear Regression
Fit a simple linear regression model and obtain the regression equation and related statistics such as r-squared. Make predictions and construct confidence intervals. Display and analyze residuals. Use preloaded data or upload your own.
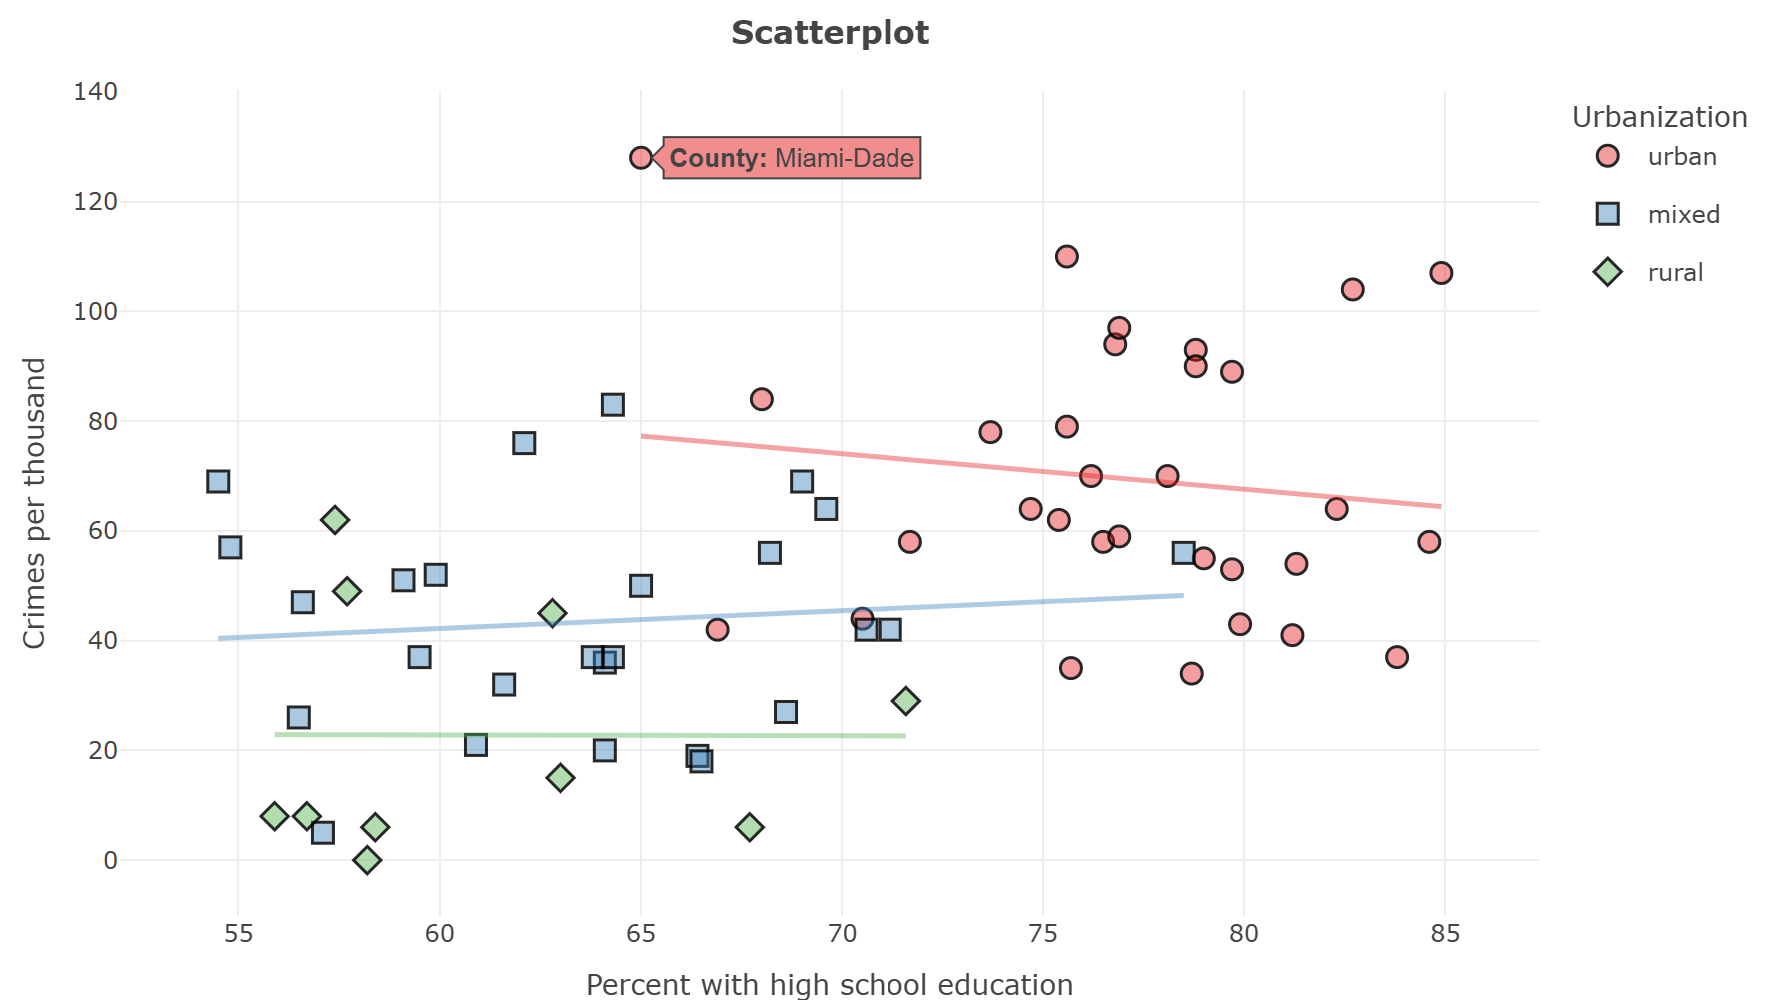
Multivariate Relationships
Construct interactive scatterplots to explore the relationship between two quantitative variables, while accounting for a third (categorical or quantitative) grouping variable.
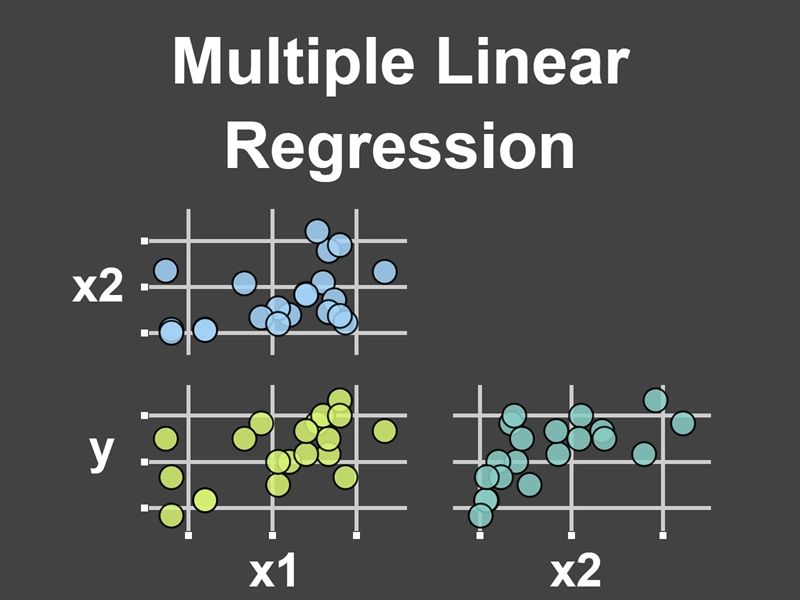
Multiple Linear Regression
Mobile app only: The Regression module of the Art of Stat mobile app (for iOS or Android) fits multiple linear regression models, with both quantitative and categorical predictors, and two-way interactions. Obtain parameter estimates and standard errors, find predicted values and analyze residual plots. Use preloaded data or upload your own.
Exponential Regression
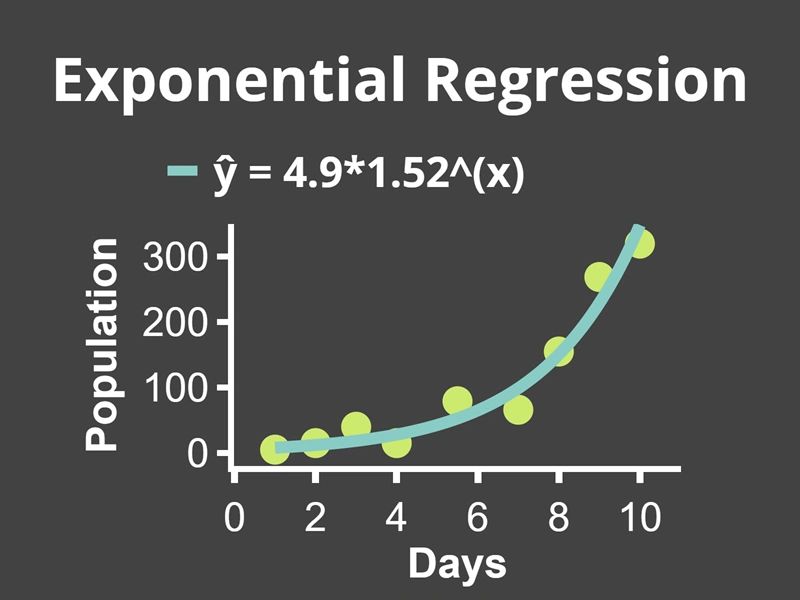
Mobile app only: The Regression module of the Art of Stat mobile app (for iOS or Android) fits simple exponential regression models. You can get parameter estimates and confidence intervals, visualize the predicted curve, and find predicted values or inspect a residual plot. Use preloaded data or upload your own.
Logistic Regression
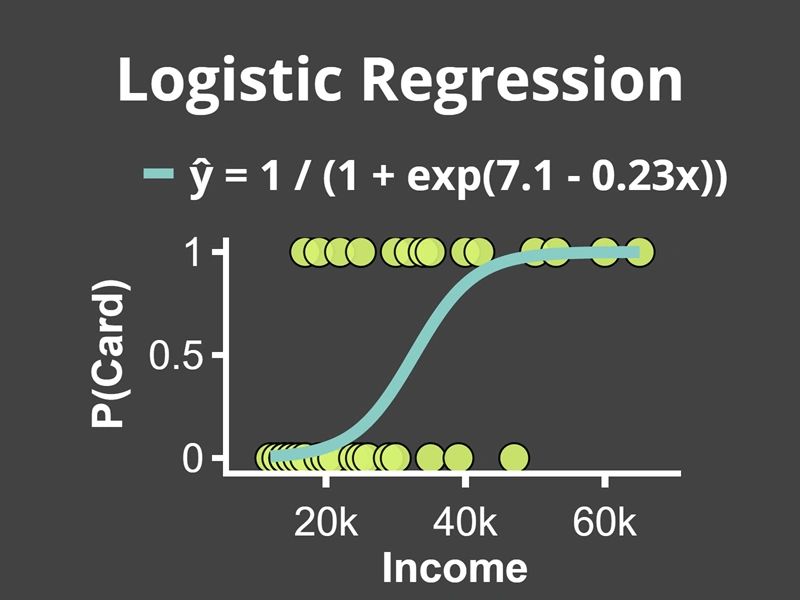
Mobile app only: The Regression module of the Art of Stat mobile app (for iOS or Android) fits multiple logistic regression models. You can get parameter estimates and confidence intervals, visualize the predicted logistic model, get a confidence band, or predict probabilities for user-supplied x-values. Use preloaded data or upload your own.
Distributions: Explore Shapes & Find Probabilities
Binomial Distribution
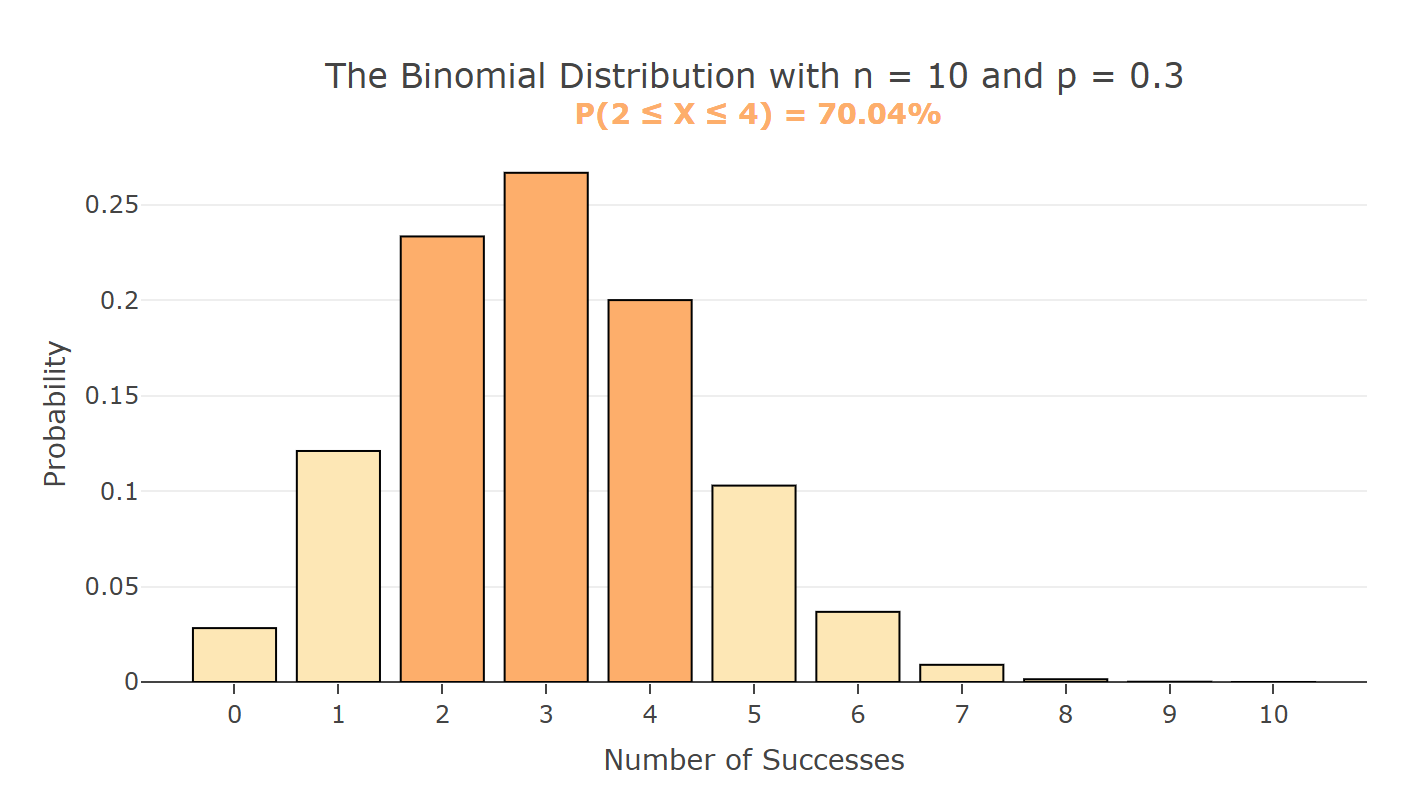
Explore how the shape of the Binomial distribution depends on the parameter n (the sample size) and p (the probability of success in a Bernoulli trial). Find and visualize probabilities of various kinds.
Normal Distribution
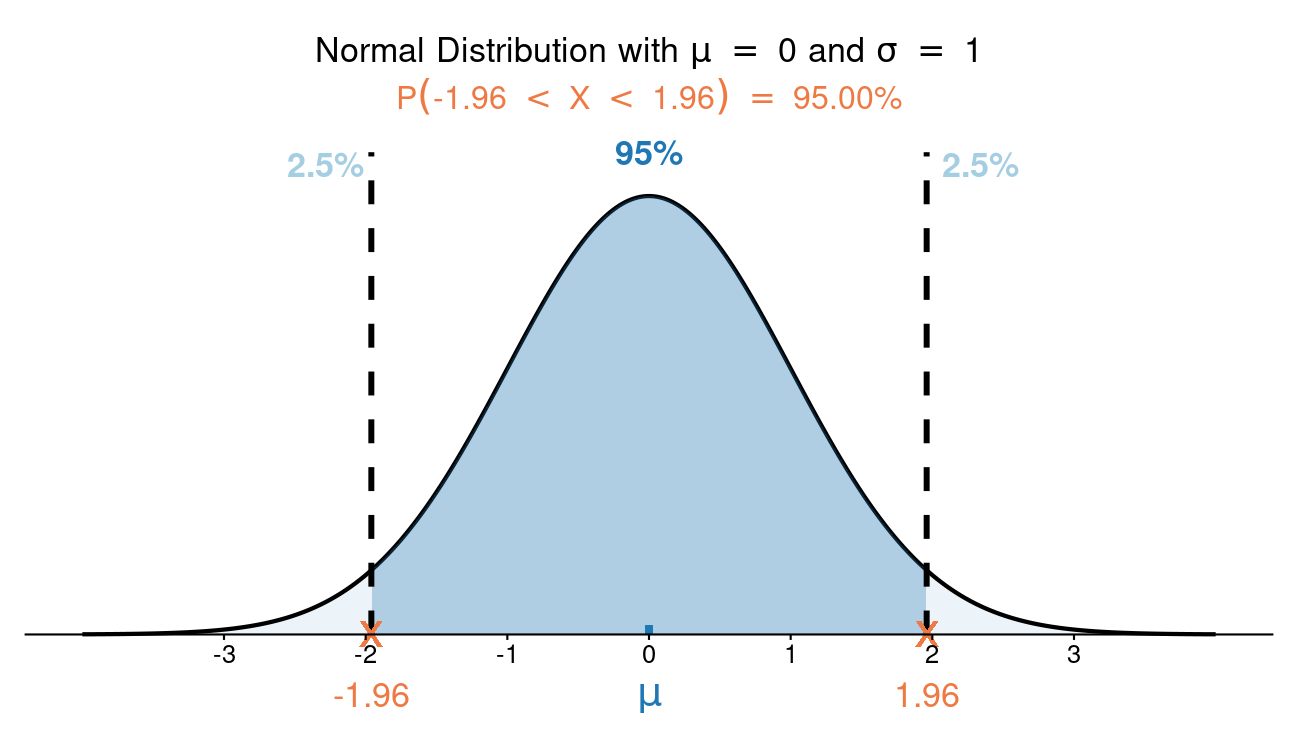
Explore how the shape of the normal distribution depends on the mean and standard deviation. Find and visualize one- and two-tailed probabilities and percentiles (critical values).
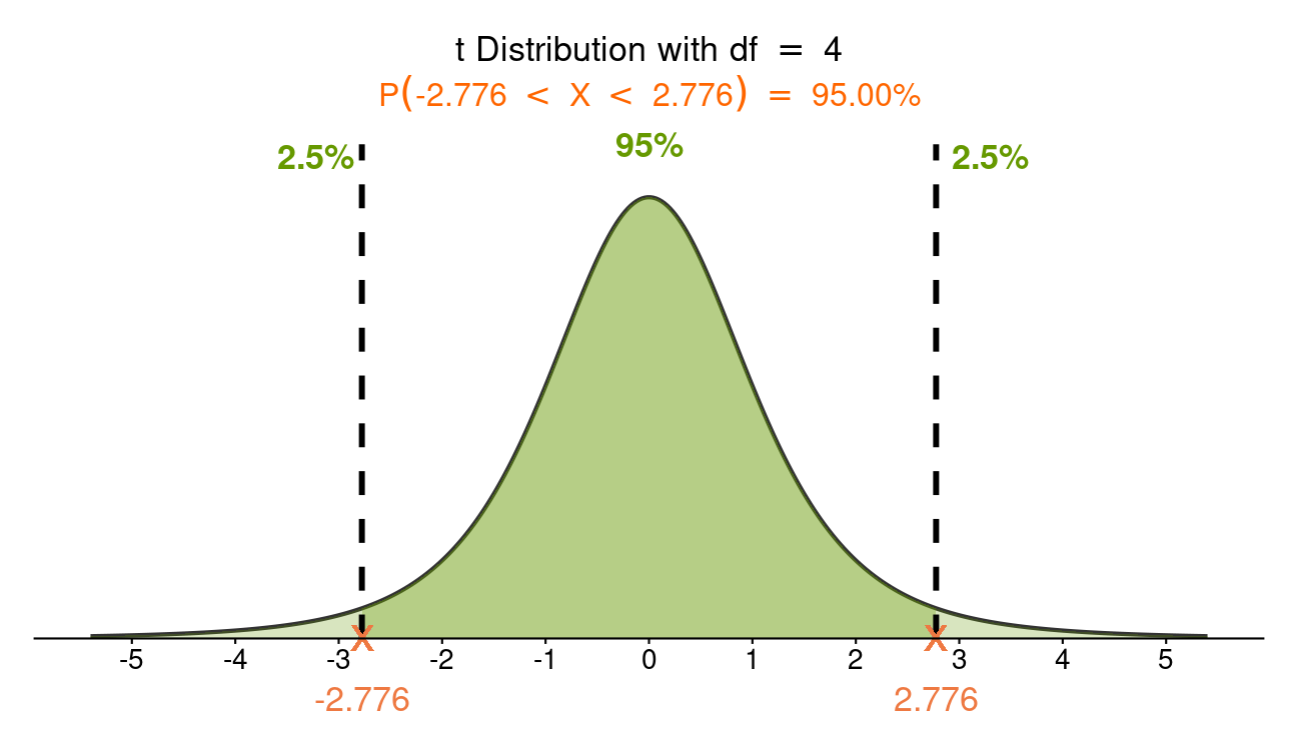
t Distribution
Explore how the shape of the t distribution depends on the degrees of freedom. Find and visualize one- and two-tailed probabilities and percentiles (critical values).
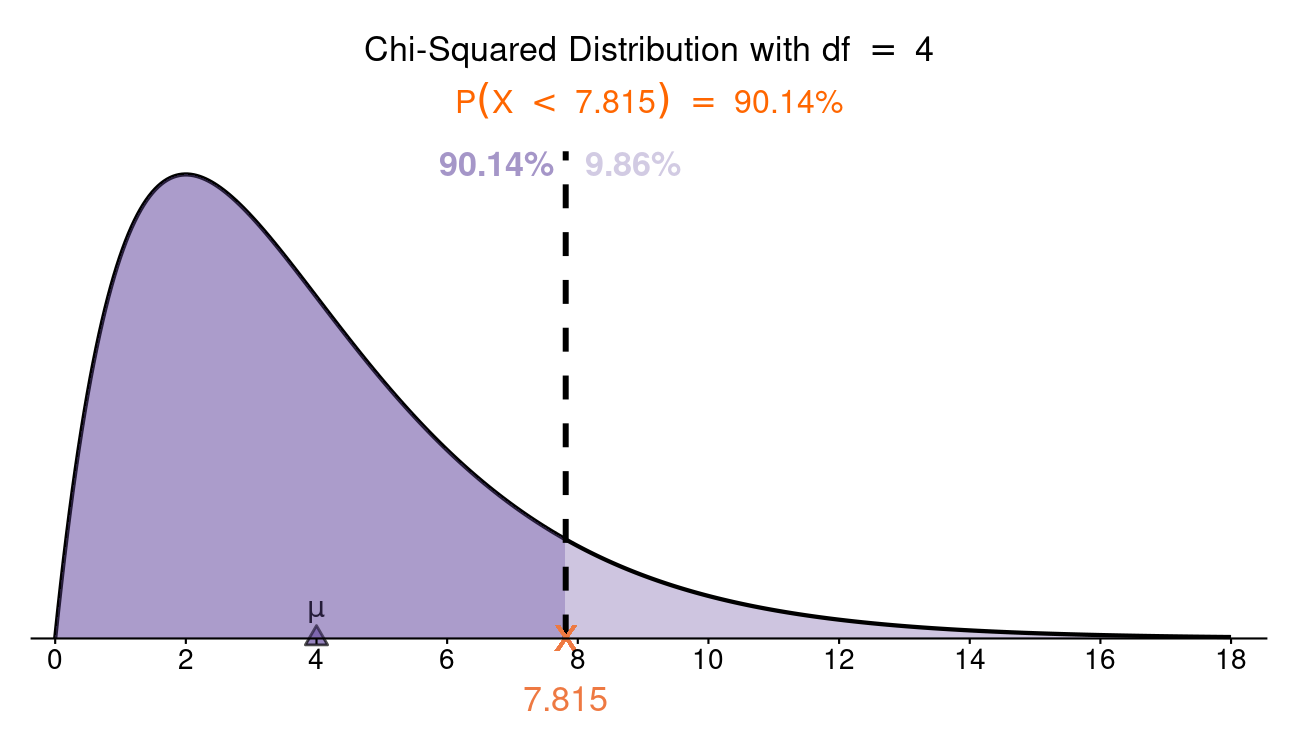
Chi-Squared Distribution
Explore how the shape of the Chi-Squared distribution depends on the degrees of freedom. Find and visualize probabilities and percentiles (critical values).
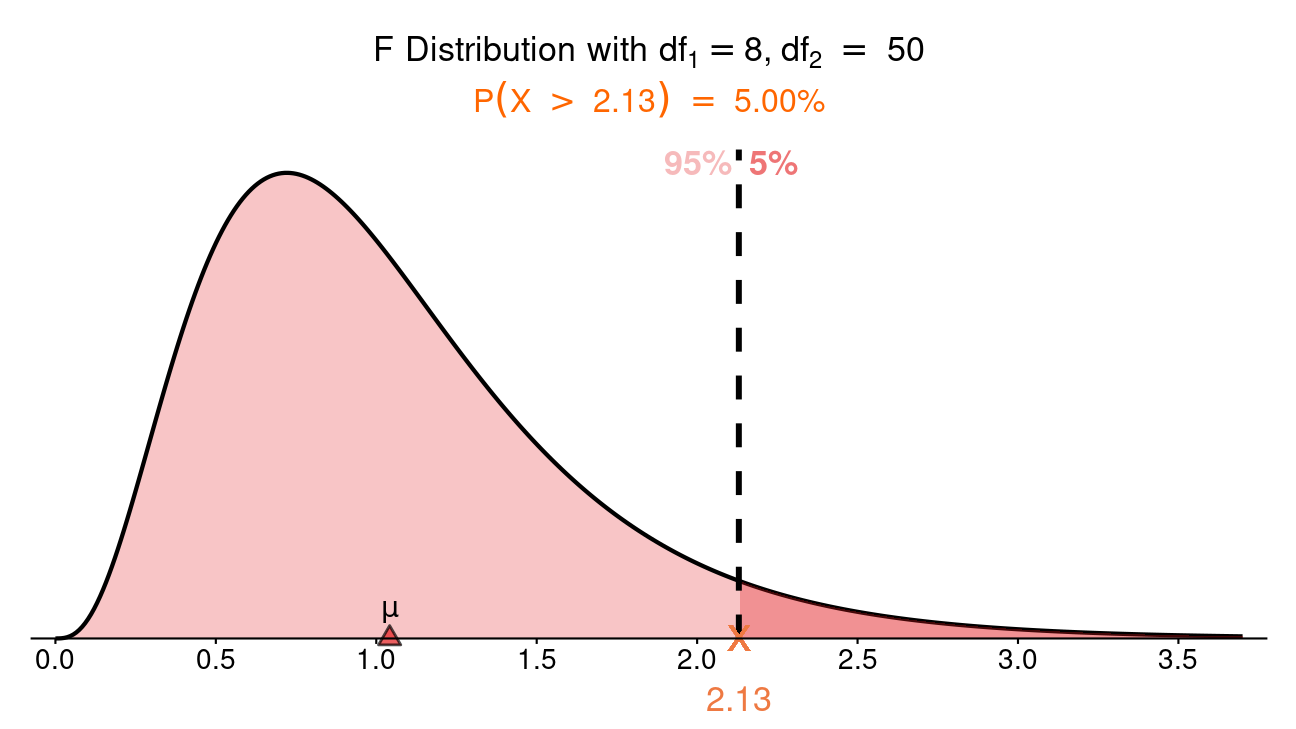
F Distribution
Explore how the shape of the F distribution depends on the degrees of freedom. Find and visualize probabilities and percentiles (critical values).
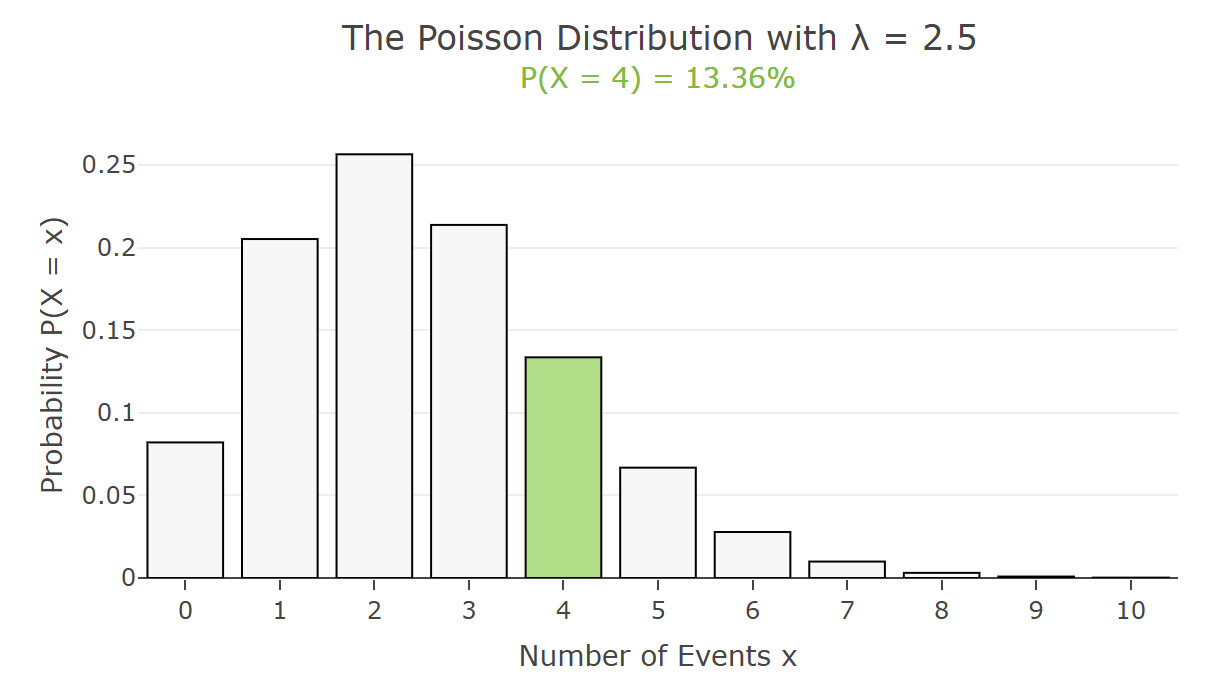
Poisson Distribution
Explore how the shape of the Poisson distribution depends on the parameter λ (the mean). Find and visualize probabilities of various kinds.
Distributions on Your Phone
The Distributions module of the Art of Stat mobile app (for iOS or Android) lets you explore and work with a variety of continuous and discrete probability distributions, including all the ones above, right on your phone.
Sampling Distributions & the Central Limit Theorem
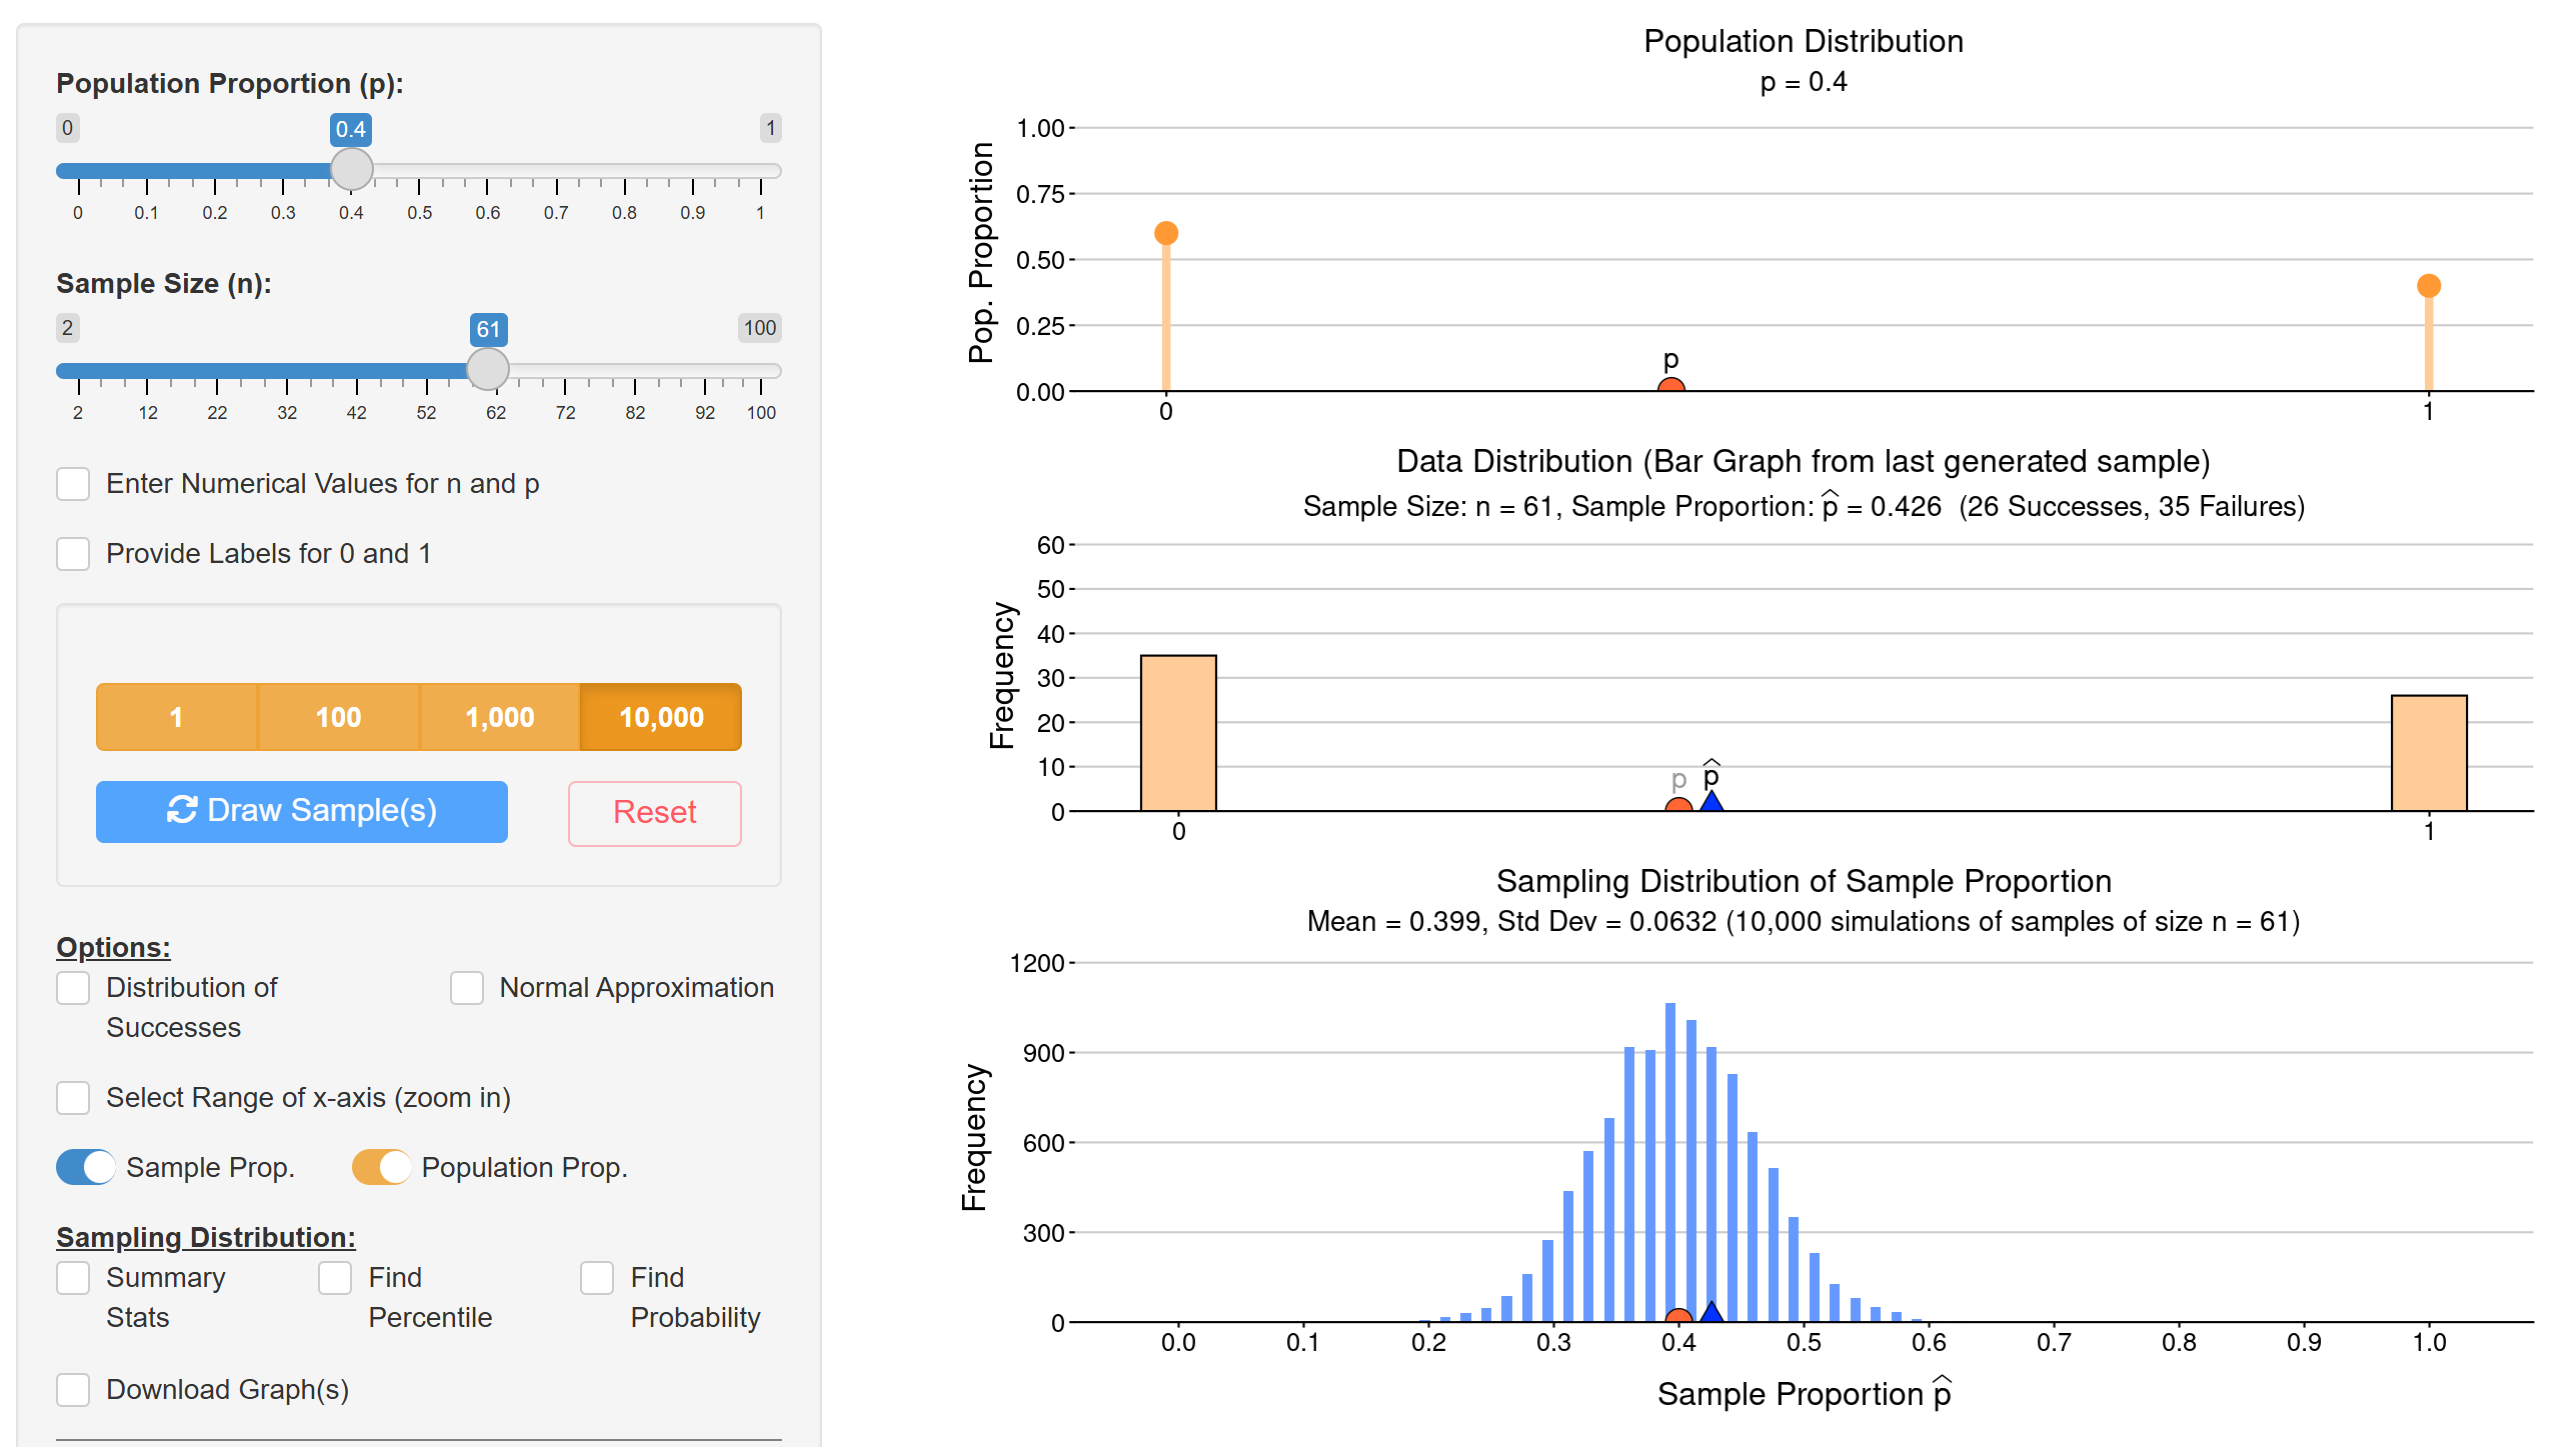
Sampling Distribution of the Sample Proportion
Explore how the sampling distribution of the sample proportion builds up one random sample at a time. Use sliders to explore the shape of the sampling distribution as the sample size n increases, or as the population proportion p changes. Overlay a normal distribution to explore the Central Limit Theorem.
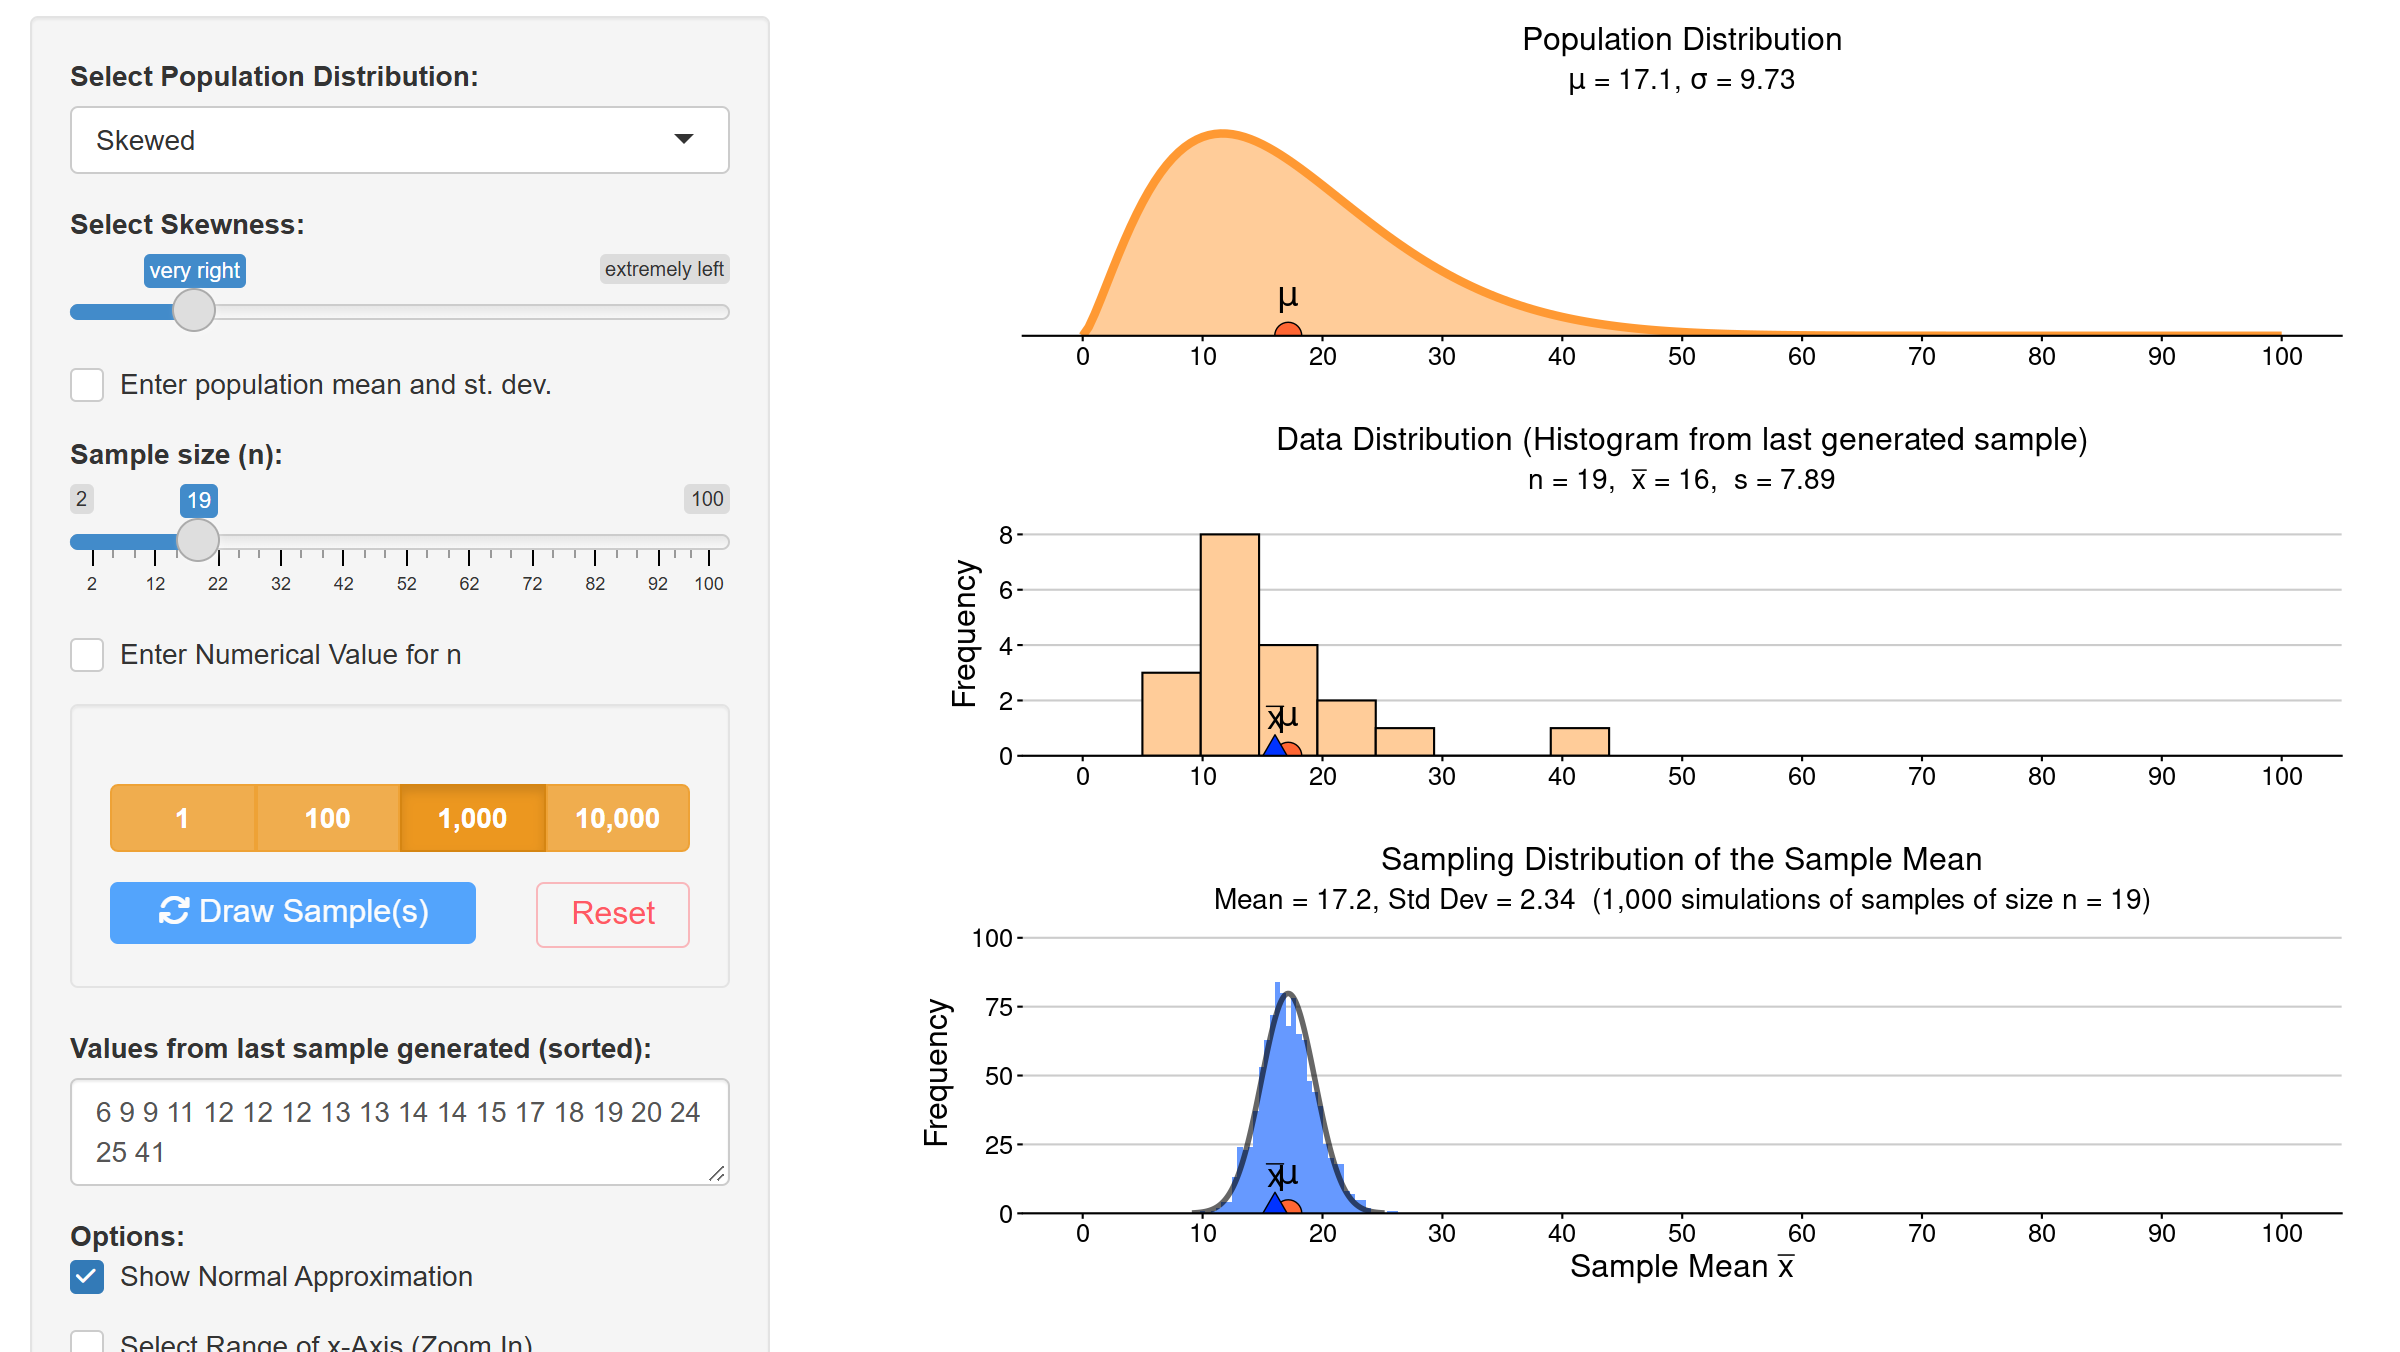
Sampling Distribution of the Sample Mean
Explore how the sampling distribution of the sample mean builds up one random sample at a time. Use a variety of real or theoretical continuous or discrete population distributions, or upload your own CSV file to draw samples from. Move sliders to explore when the Central Limit Theorem kicks in.
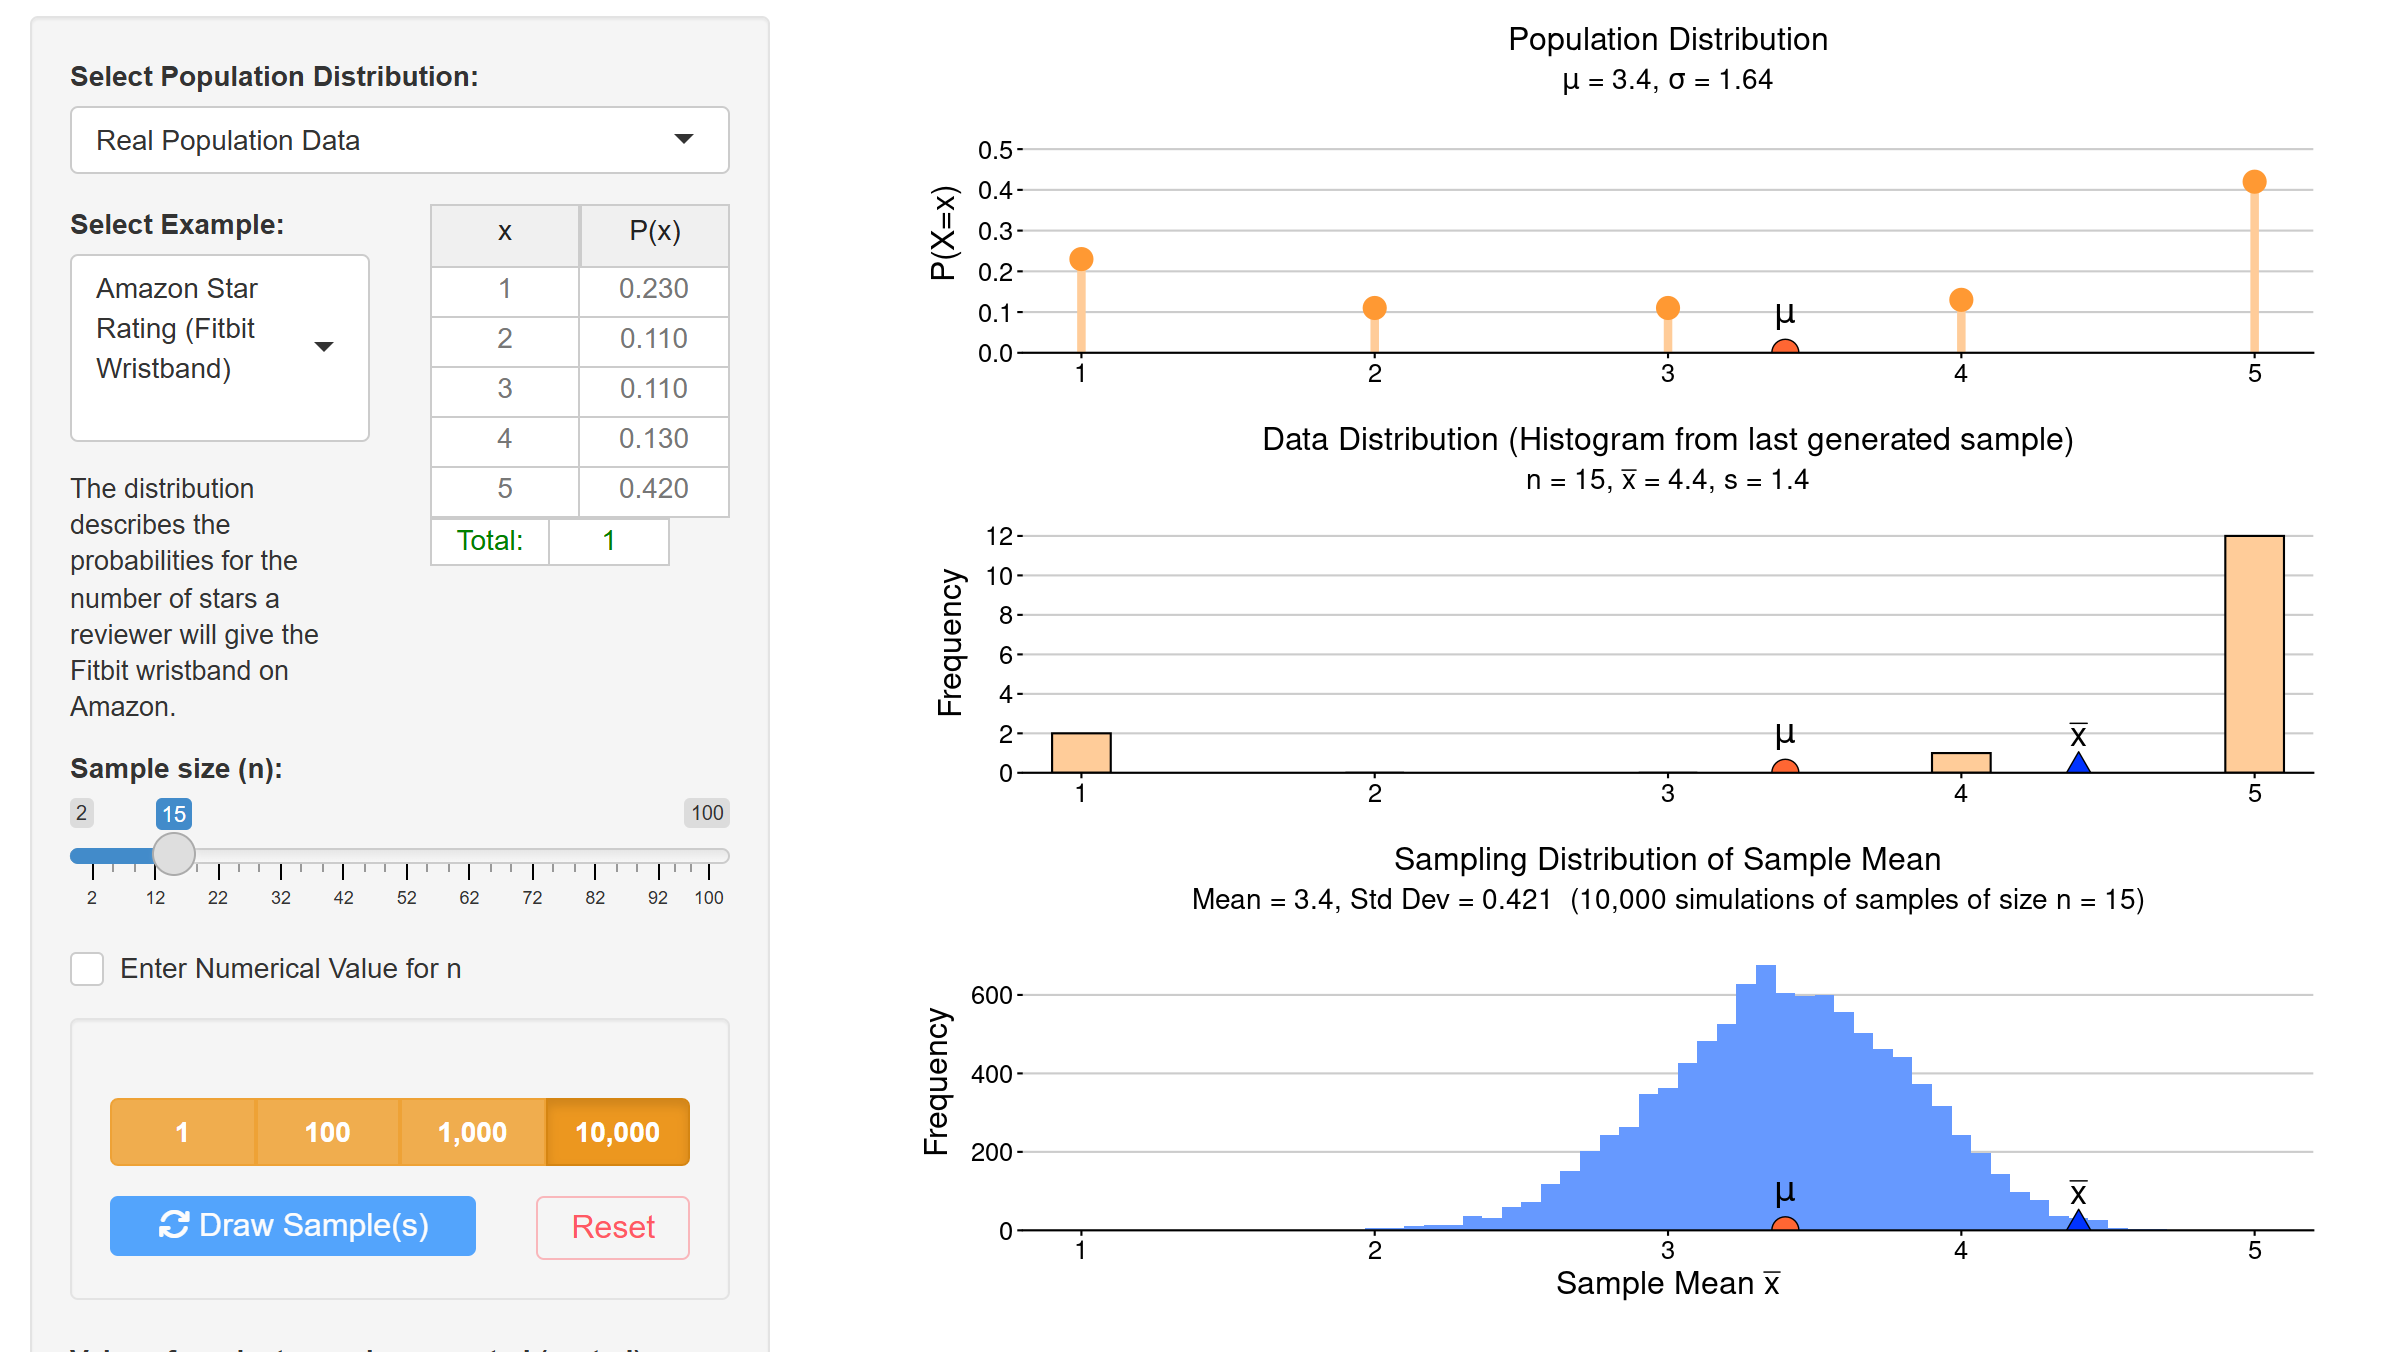
Sampling Distribution of the Sample Mean (Discrete Population)
Drawing samples from a discrete population is now incorporated in the Sampling Distribution for the Sample Mean app. Check the second tab on top of that app.
Concepts on Your Phone
The Concepts module of the Art of Stat mobile app (for iOS or Android) lets you explore the Central Limit Theorem and concepts such as coverage probability, power, and correlation & linear regression, right on your phone.
Confidence Intervals & Significance Tests (One Sample)
Inference for a Proportion
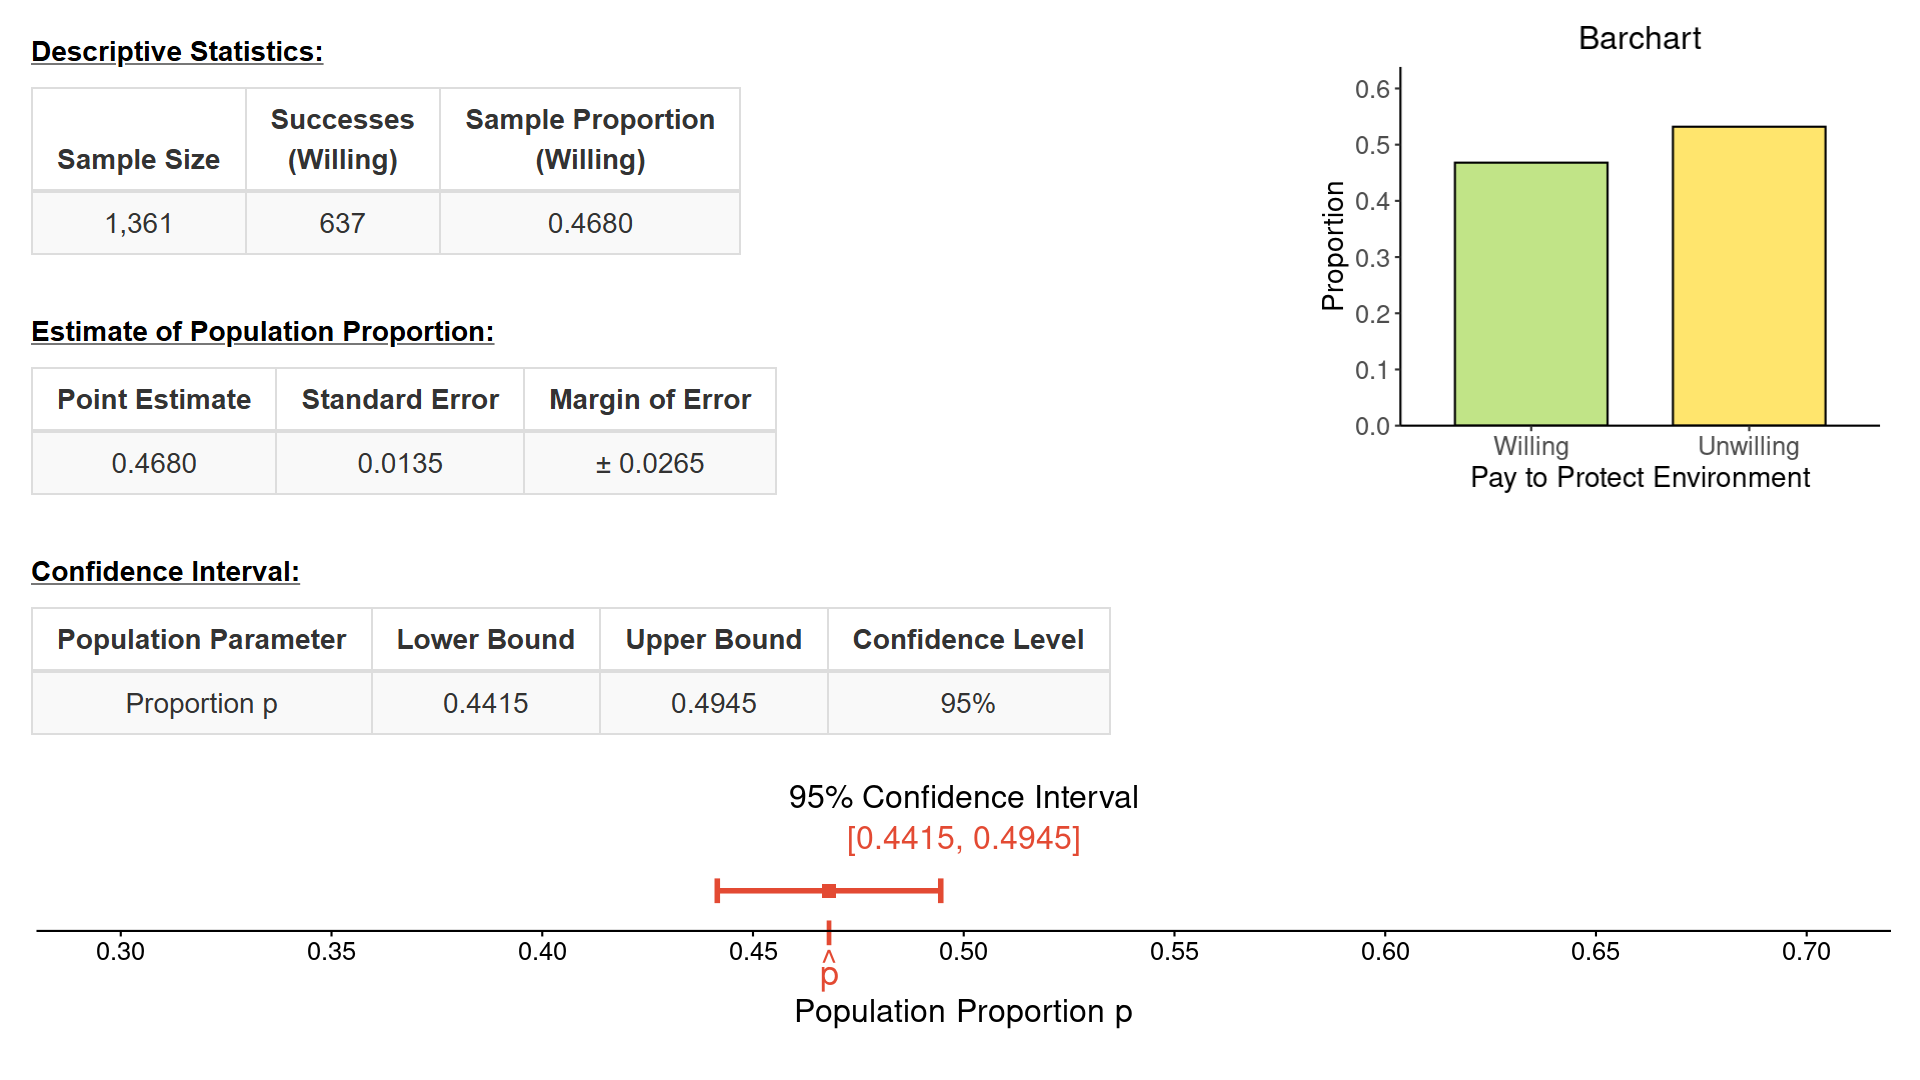
Find confidence intervals or test hypotheses about a population proportion. Obtain the margin of error or the z-test statistic and visualize the interval or the P-value on a graph.
Inference for a Mean
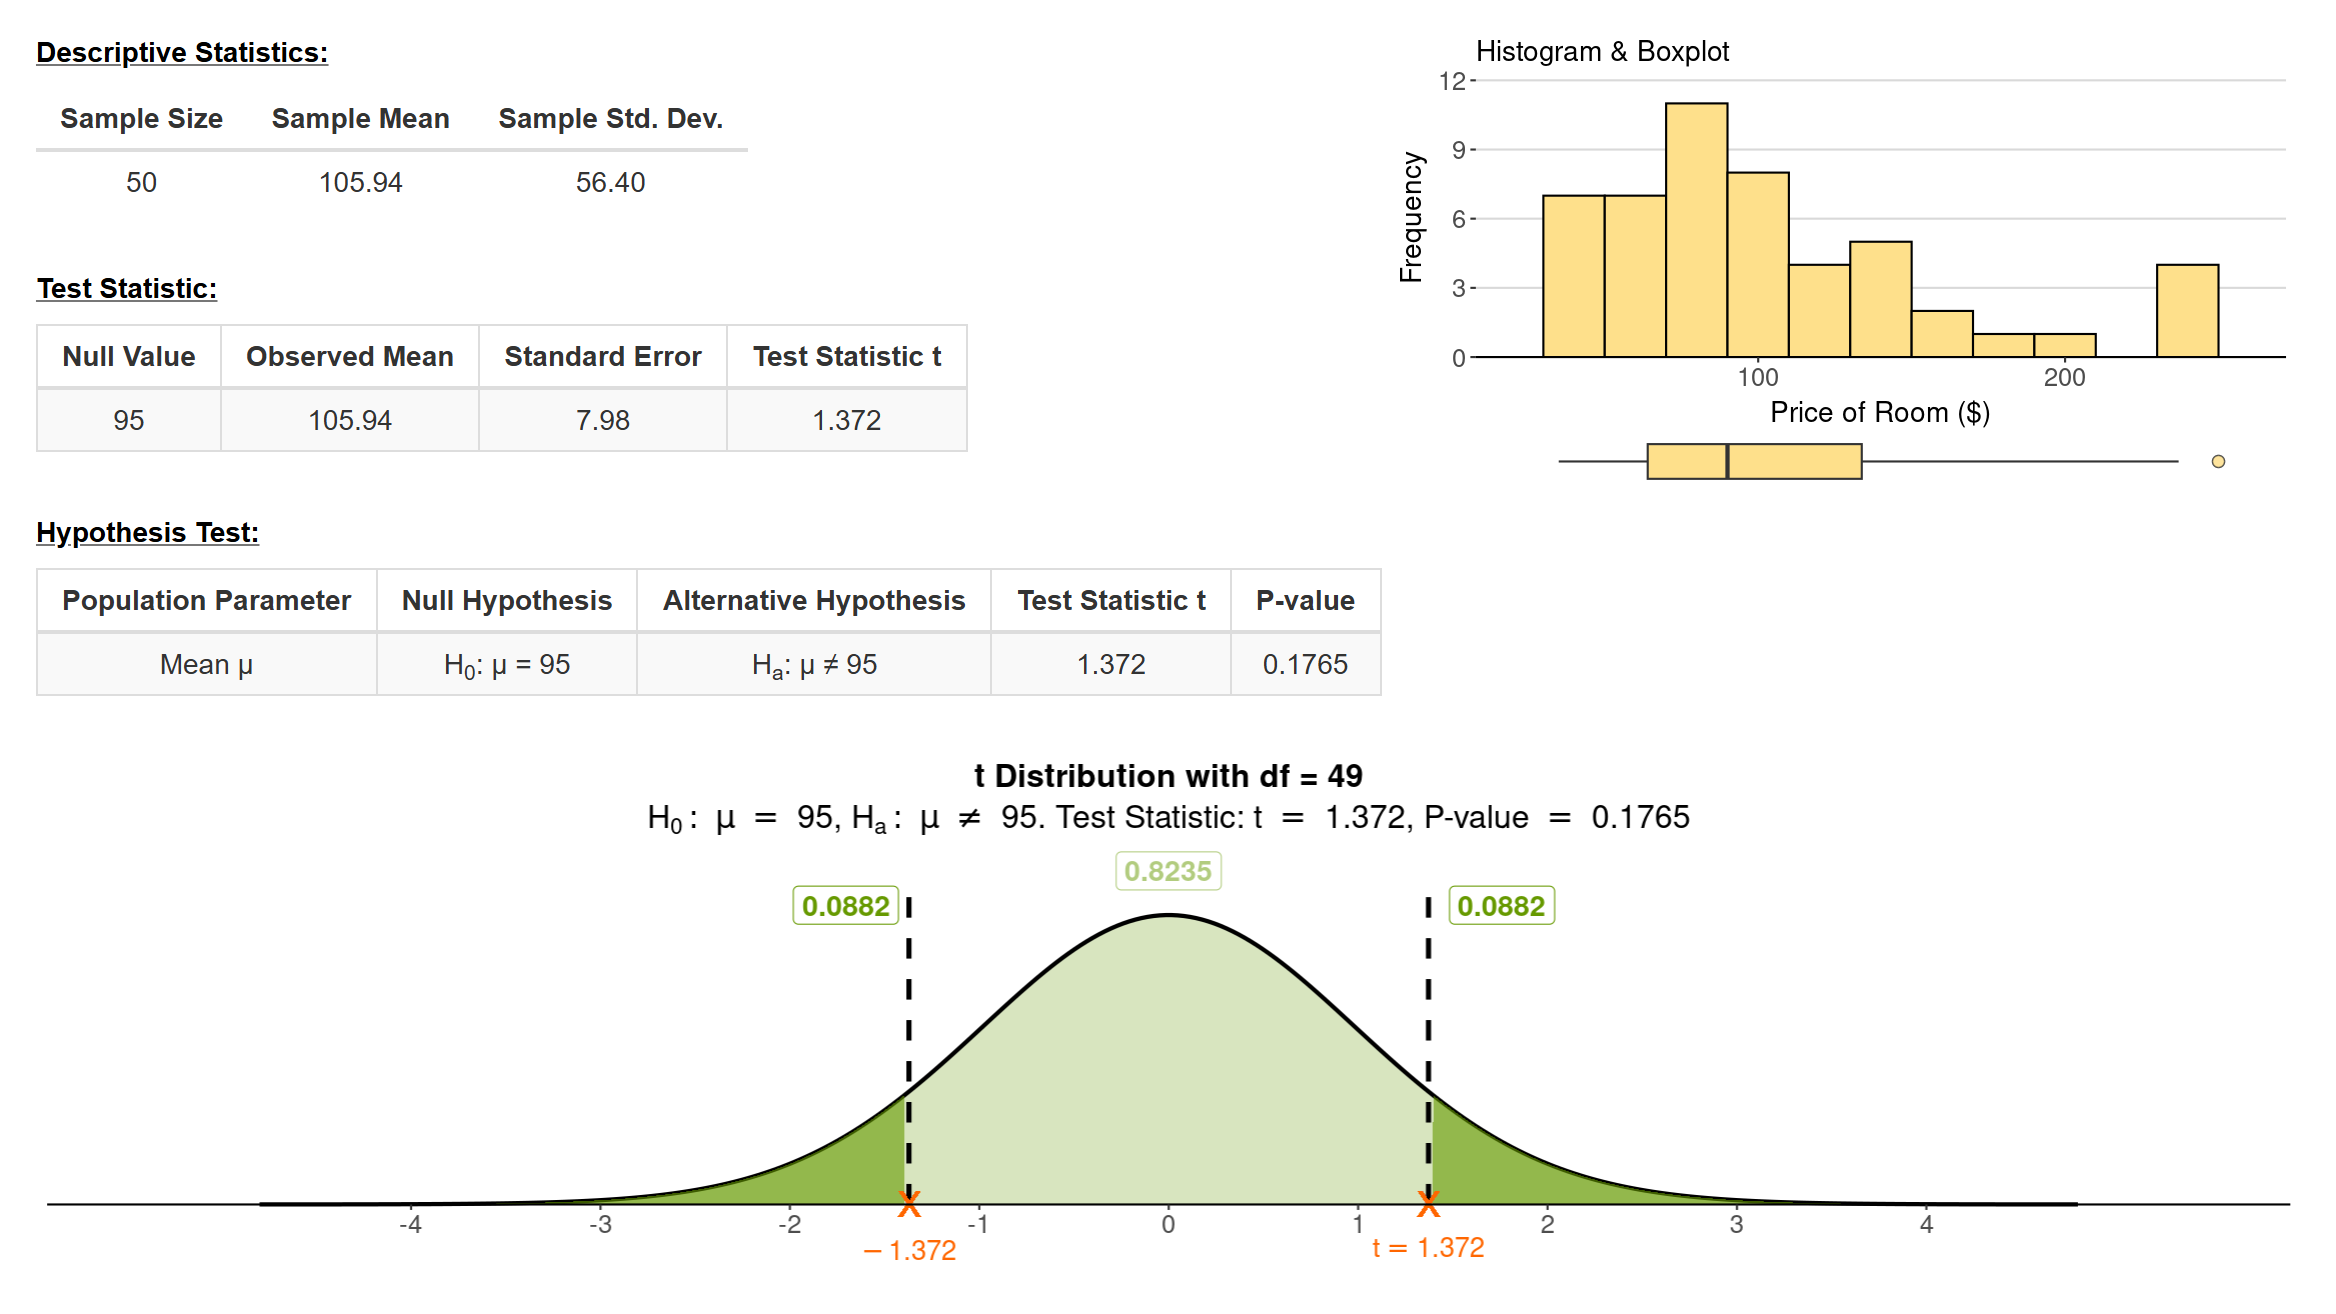
Find confidence intervals or test hypotheses about a population mean. Enter your own data or summary statistics. Use plots to check assumptions and visualize the interval or the P-value on a graph.
Bootstrap for One Sample
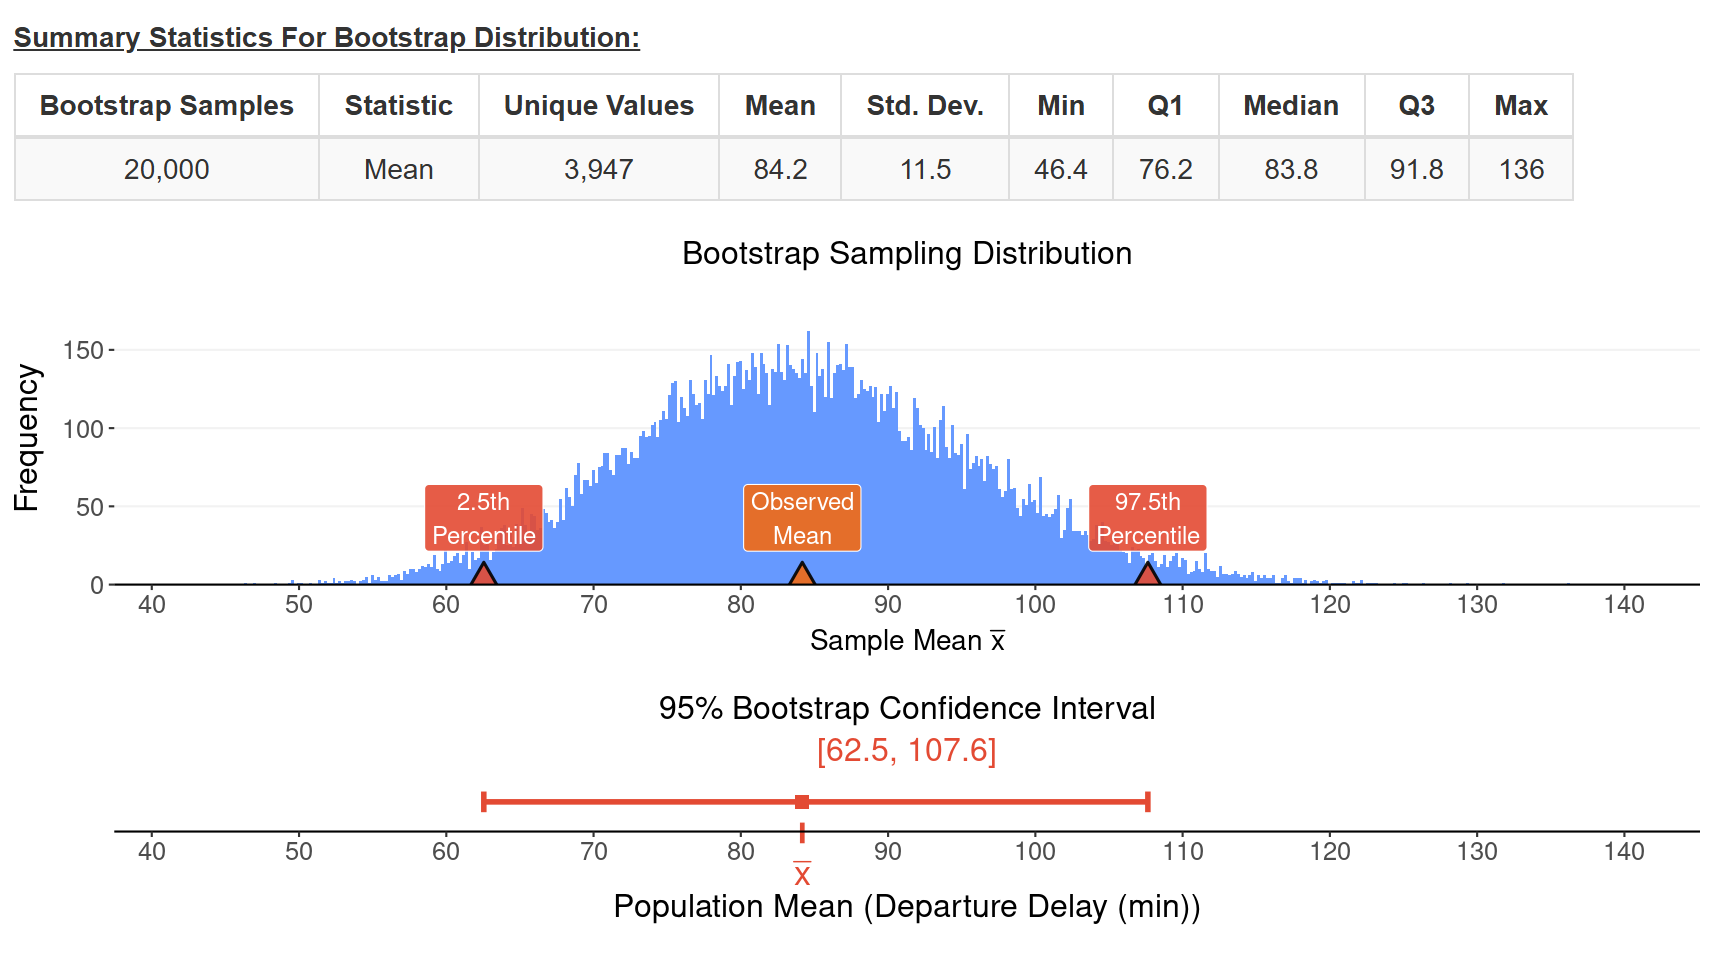
Create and visualize, step-by-step, the bootstrap distribution of the mean, median or standard deviation. Obtain summary statistics and find a percentile confidence interval.
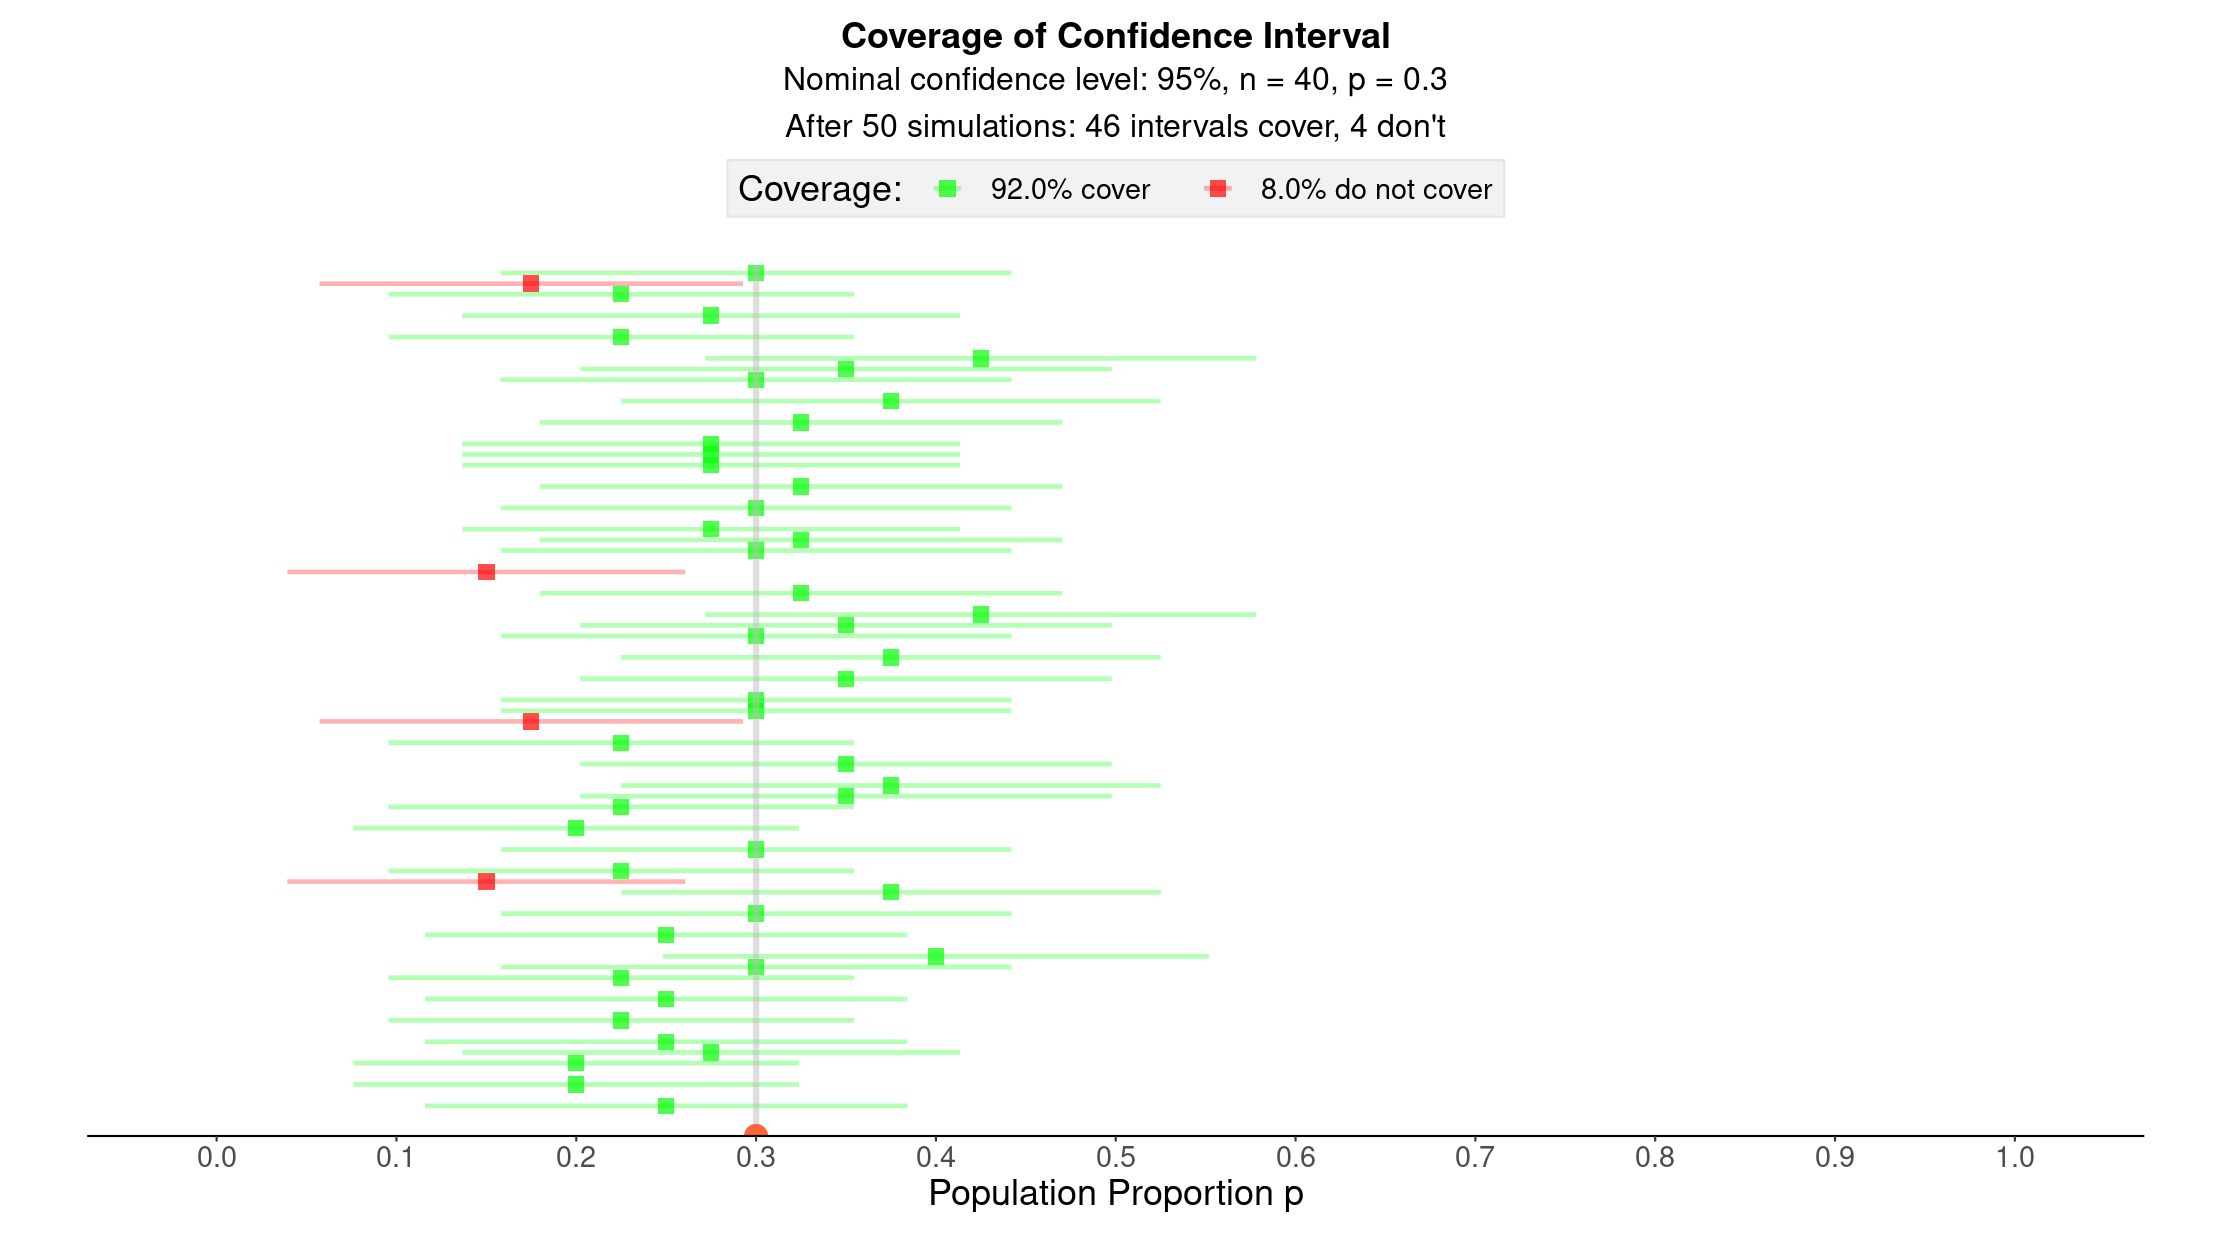
Explore Coverage
What does "95% confidence" mean? What affects the width of an interval? Explore these concepts for confidence intervals of proportions or means, using sliders to change parameters or the sample size.
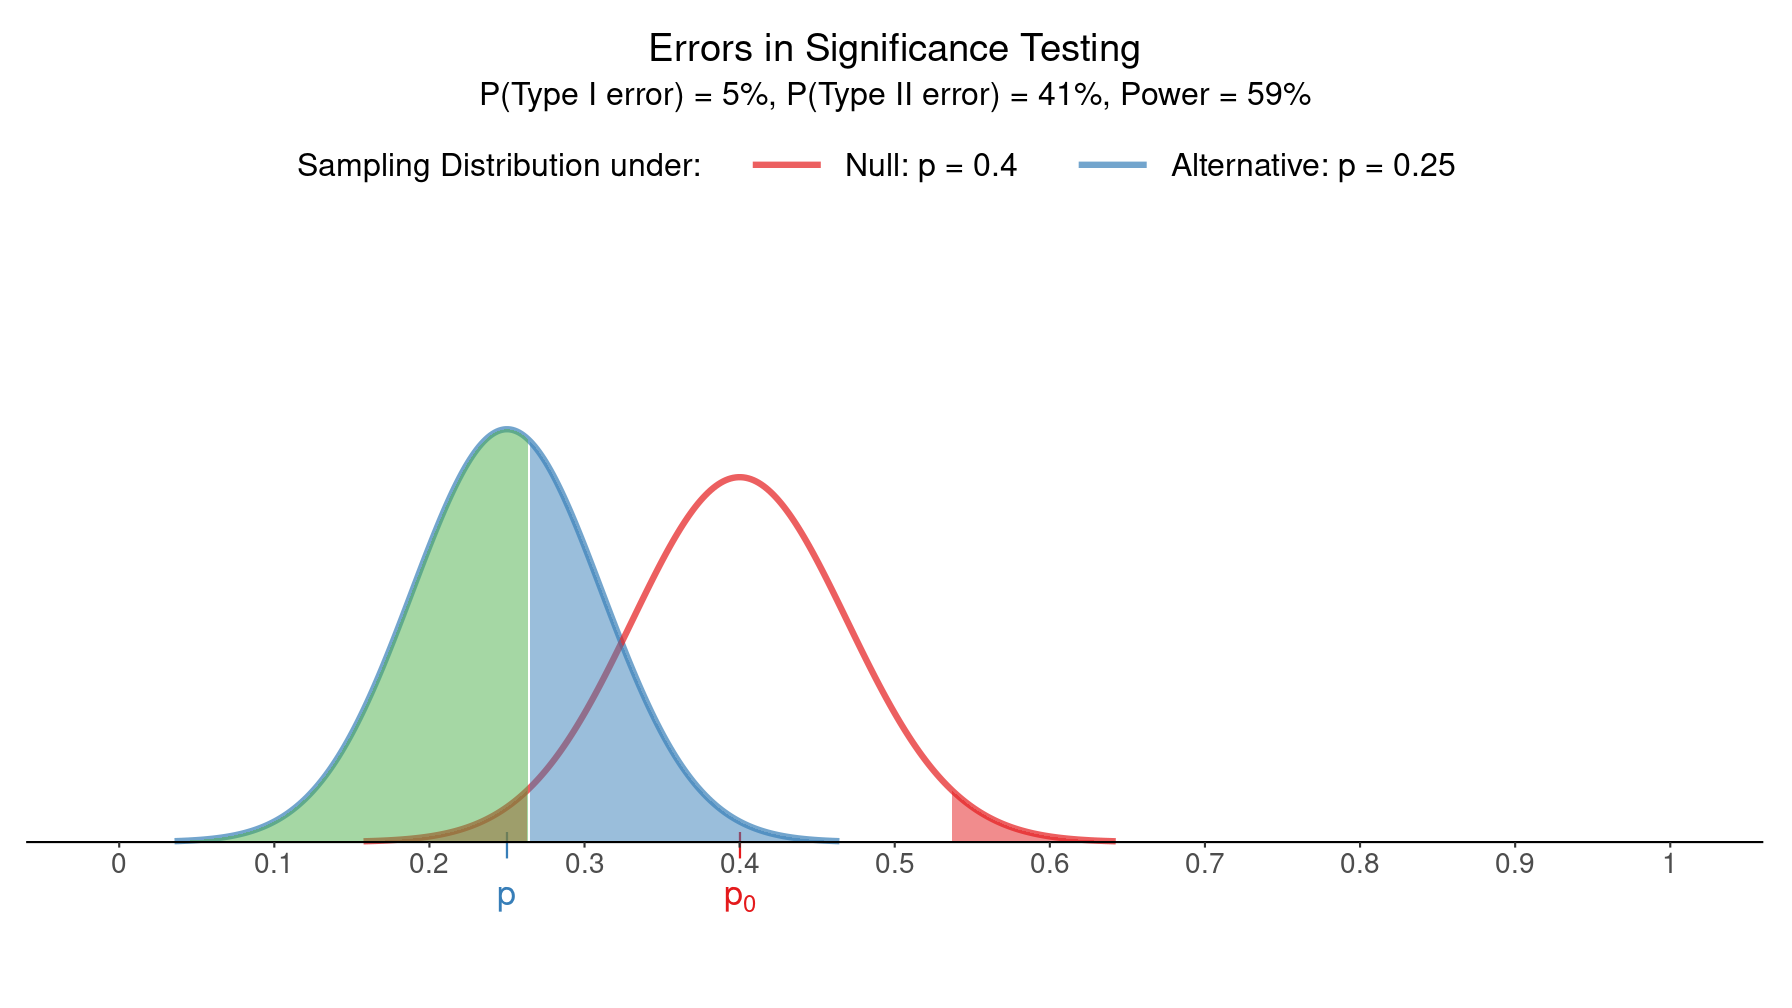
Errors and Power
Visualize and explore relationships between Type I and Type II errors and the power of a test for proportions or means. See how they depend on sample size and the true values of population parameters.
Inference on Your Phone
The Inference module of the Art of Stat mobile app (for iOS or Android) finds confidence intervals and carries out significance tests for one and two samples, right on your phone.
Confidence Intervals & Tests Comparing Two Groups
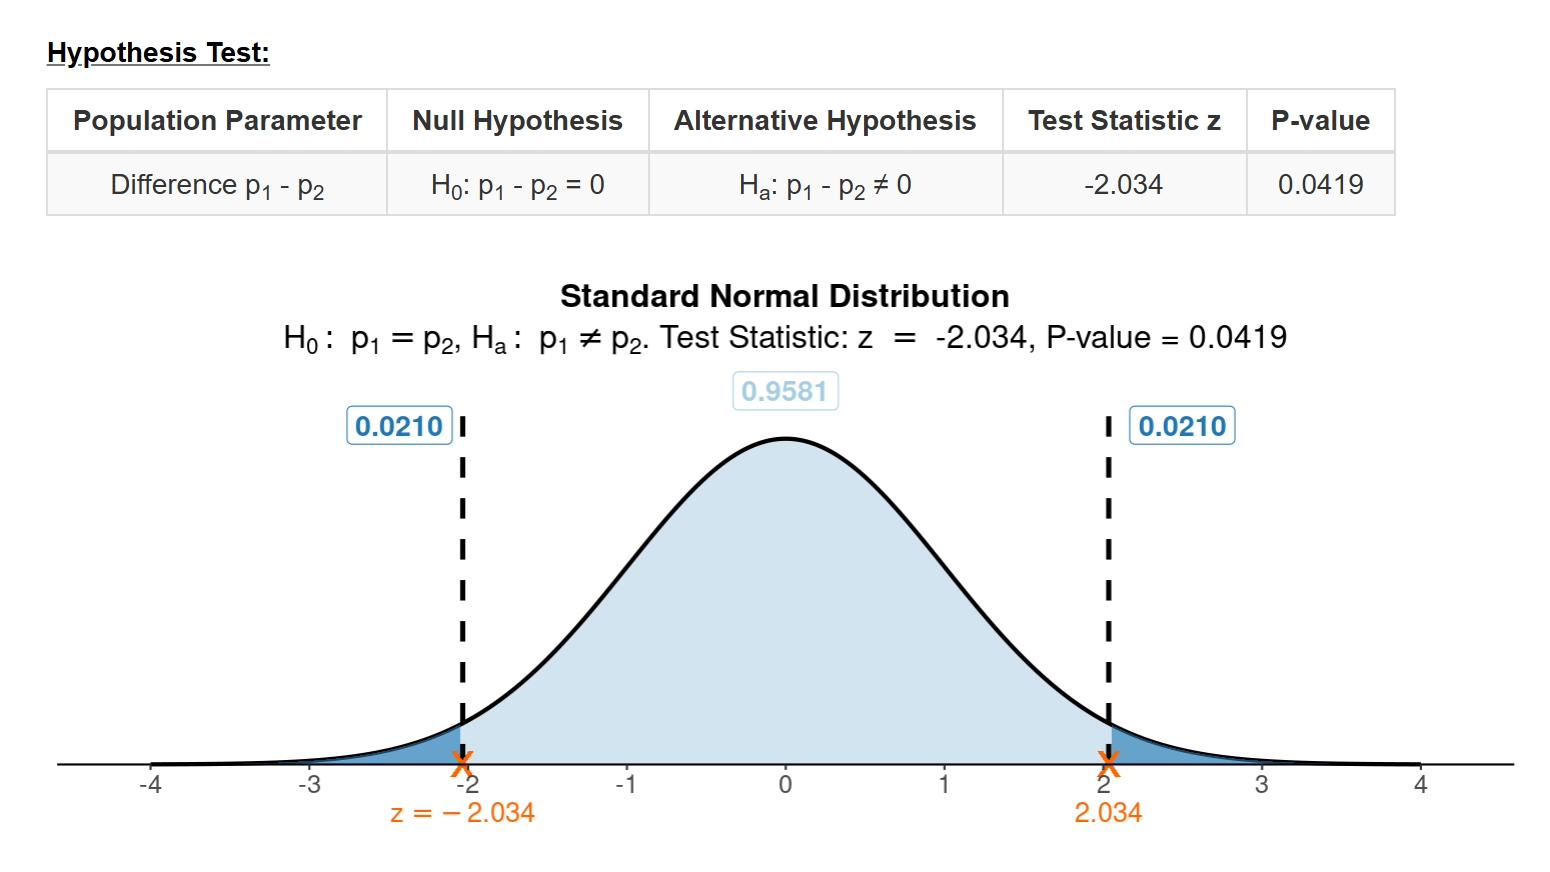
Compare Two Proportions
Confidence intervals or hypothesis tests about the difference of two population proportions. Obtain the margin of error or the z-test statistic and visualize the interval or the P-value on a graph. For two independent or dependent samples.
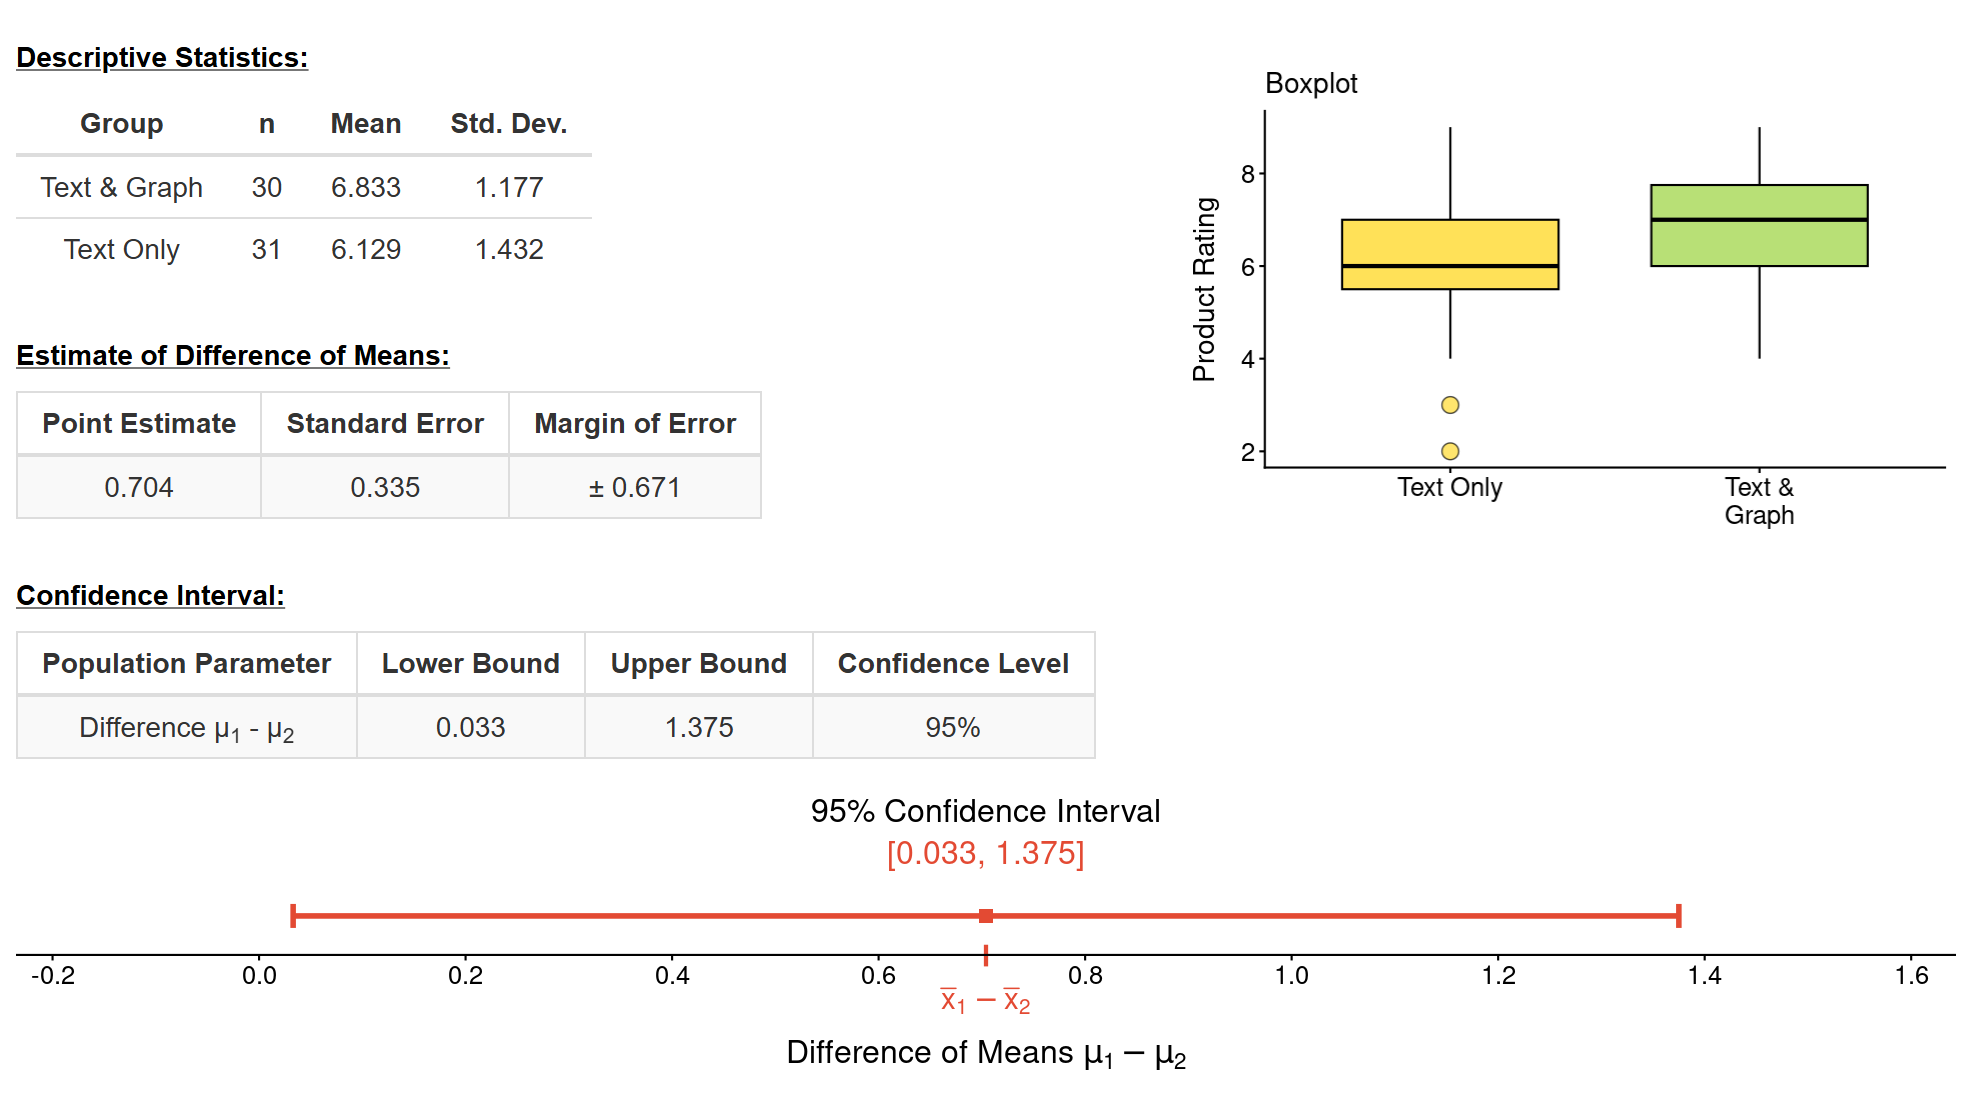
Compare Two Means
Confidence intervals or hypothesis tests about the difference of two population means. Enter your own data or summary statistics. Visualize the interval or the P-value on a graph. For two independent or dependent samples.
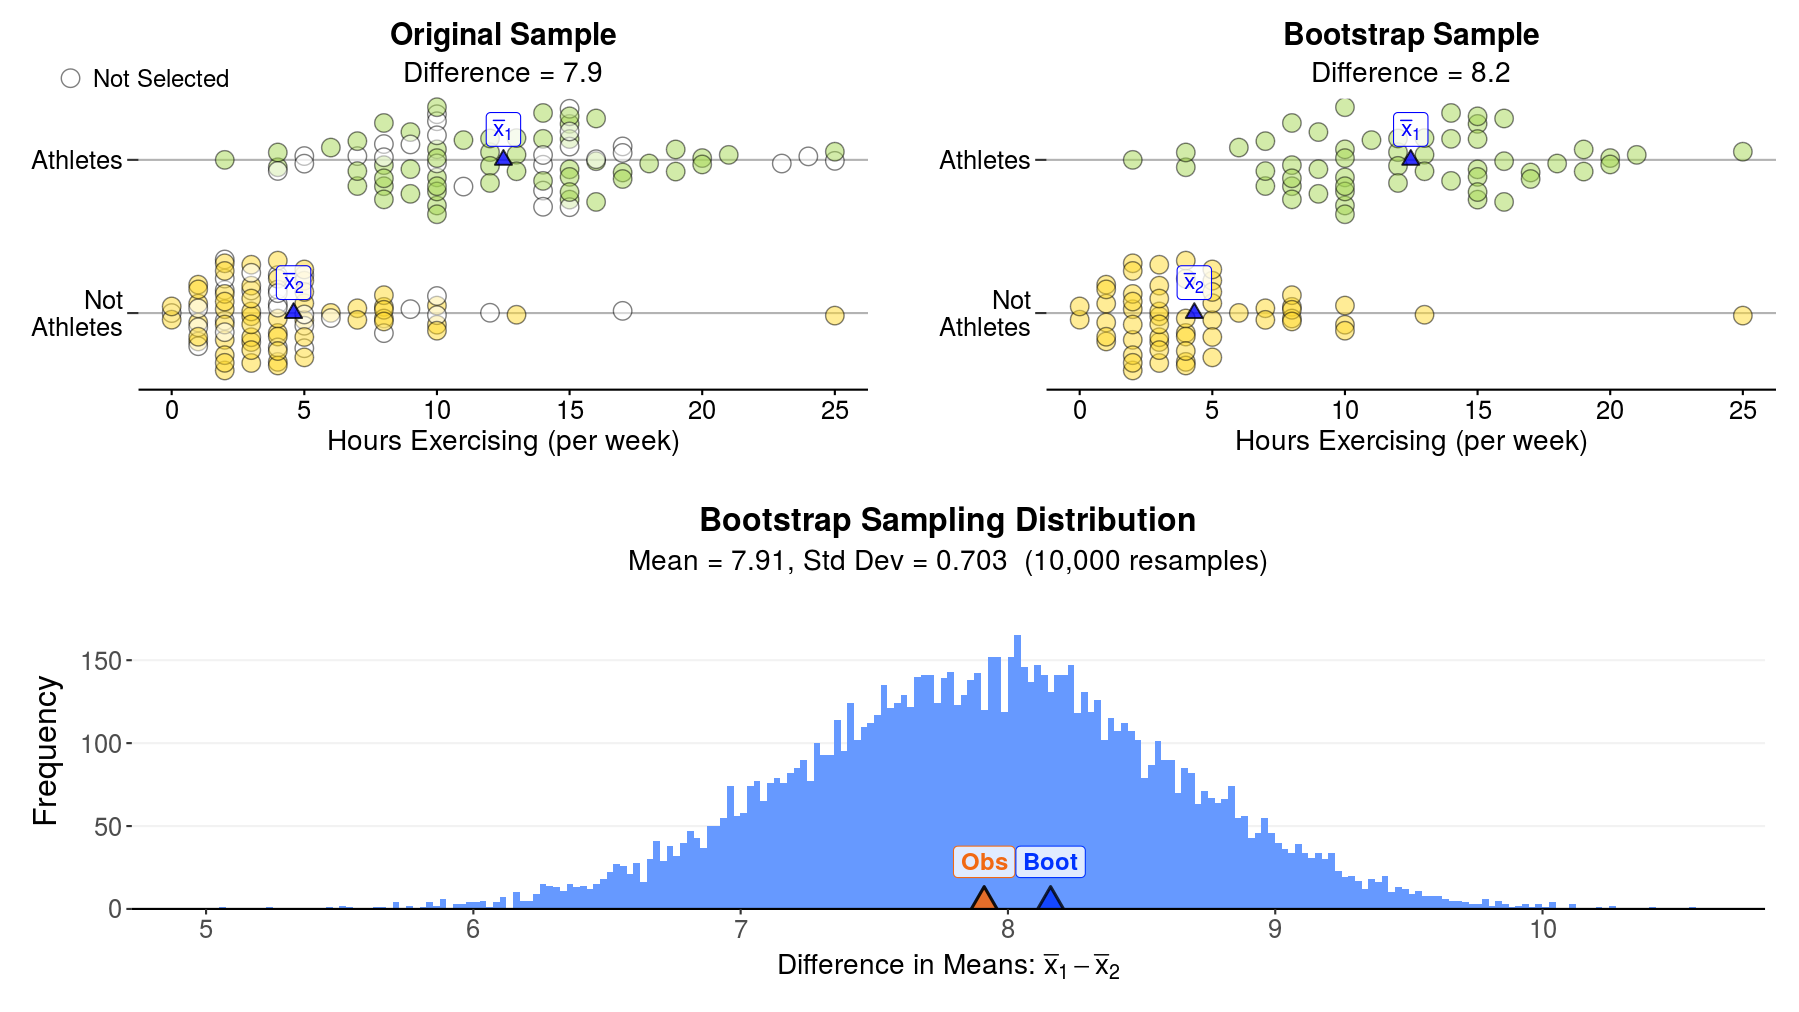
Bootstrap for Two Samples
Create and visualize, step-by-step, the bootstrap distribution for the difference of means or medians. Obtain summary statistics (such as percentiles) of the bootstrap distribution and find a percentile confidence interval.
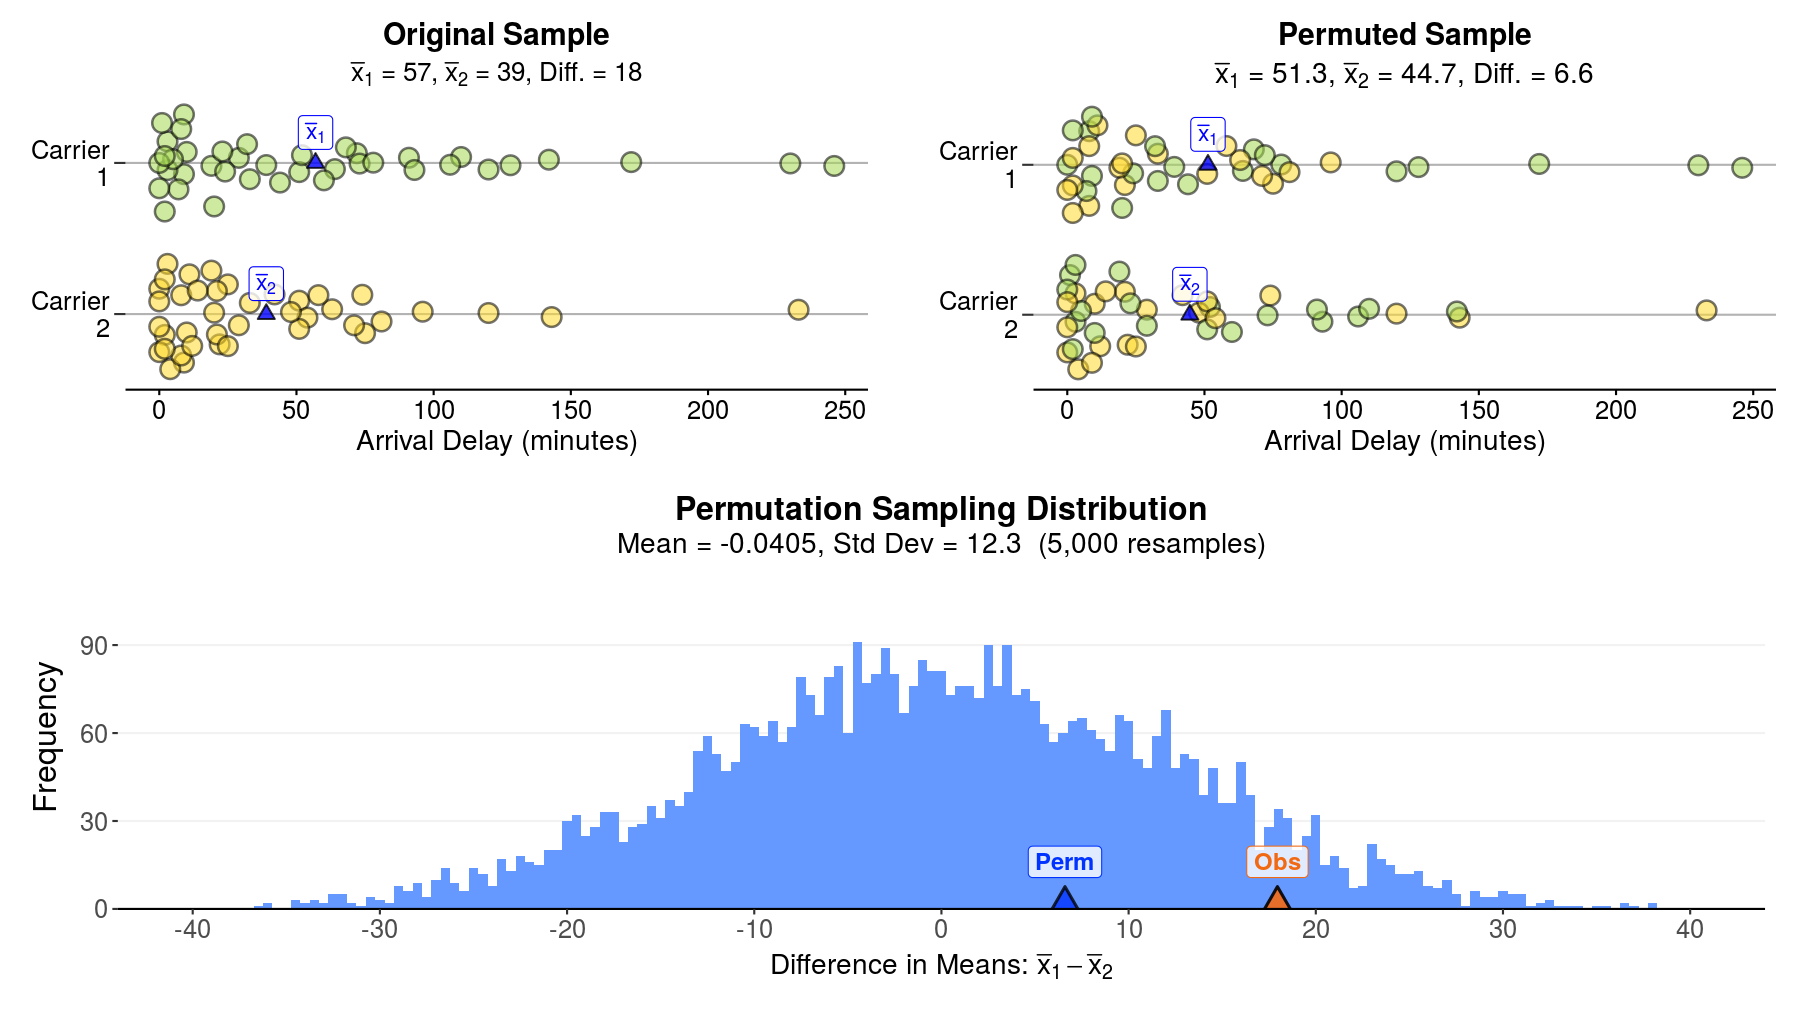
Permutation Test
Create and visualize, step-by-step, the permutation distribution for statistics such as the difference of means or medians or the t-statistic. Obtain summary statistics (such as percentiles) and find the permutation P-value.
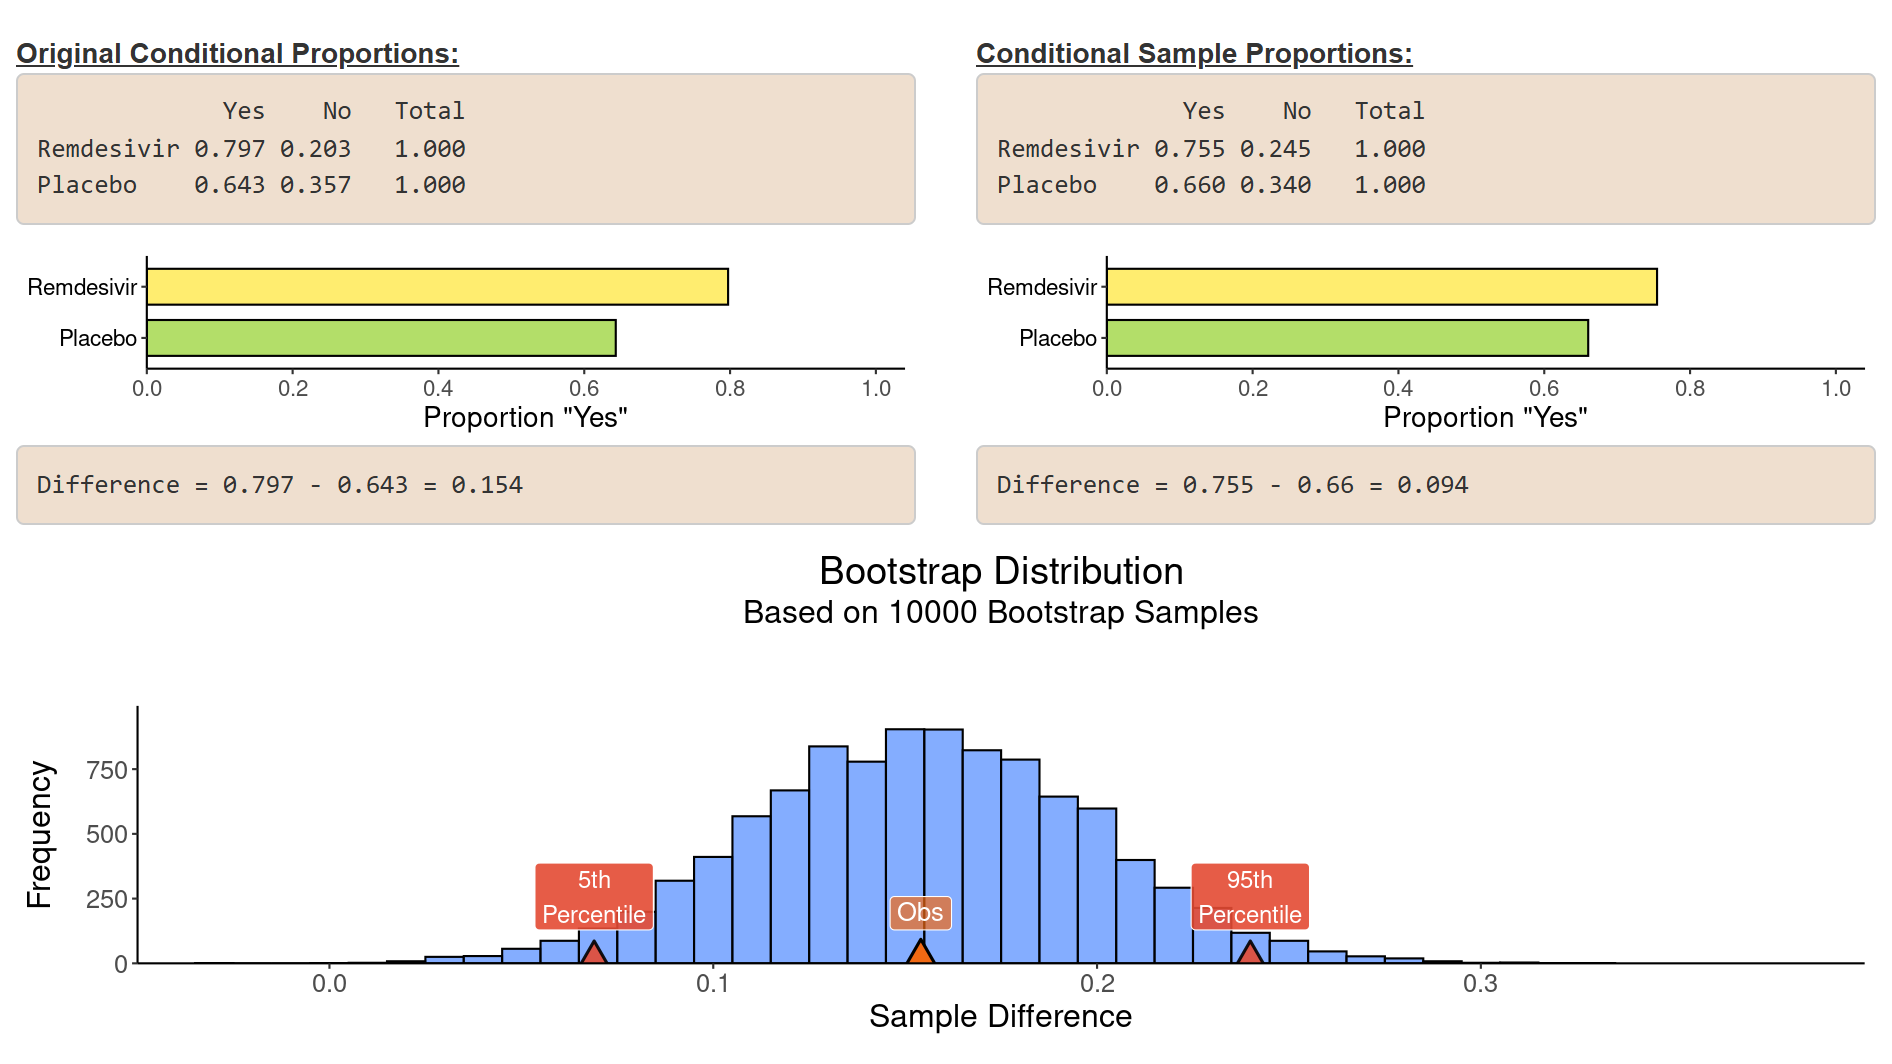
Difference & Ratio of Proportions
Find the bootstrap or permutation distribution for the difference or ratio of two proportions, or for the odds-ratio. Use these to obtain percentile confidence intervals or permutation P-values for testing whether there is no association.
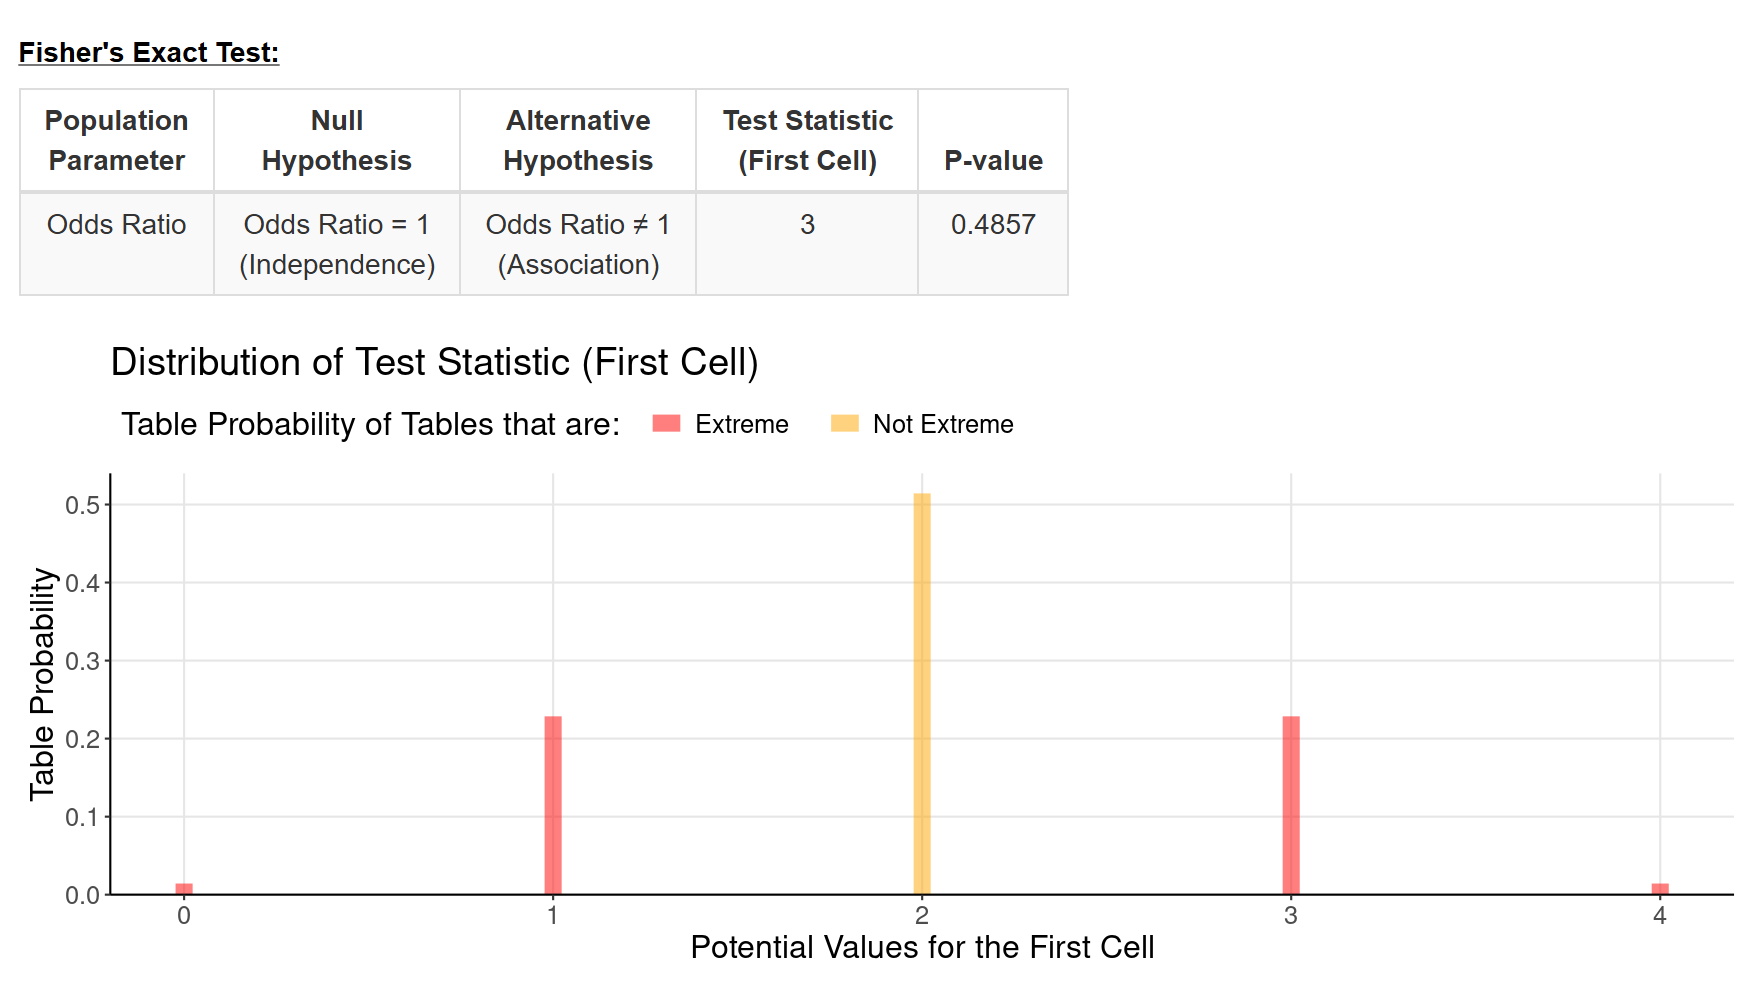
Fisher's Exact Test
Visualize and run Fisher's exact test for 2 x 2 contingency tables. Obtain the exact P-value for one- or two-sided tests.
Inference for Comparing Several Groups
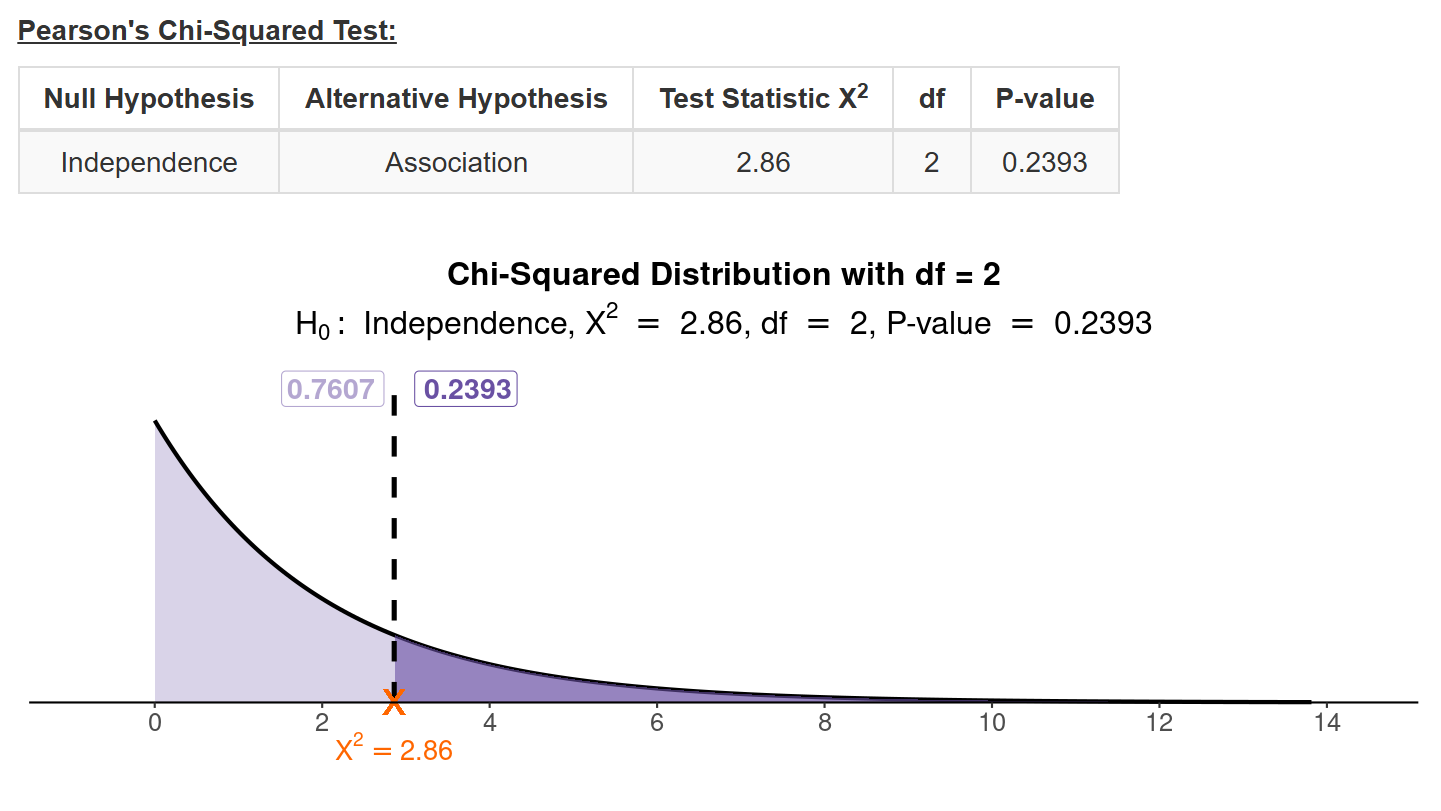
Chi-Squared Test
Test for independence, homogeneity or goodness of fit in contingency tables. Enter your own data as raw observations or as a contingency table. Obtain observed and expected counts and find residuals.
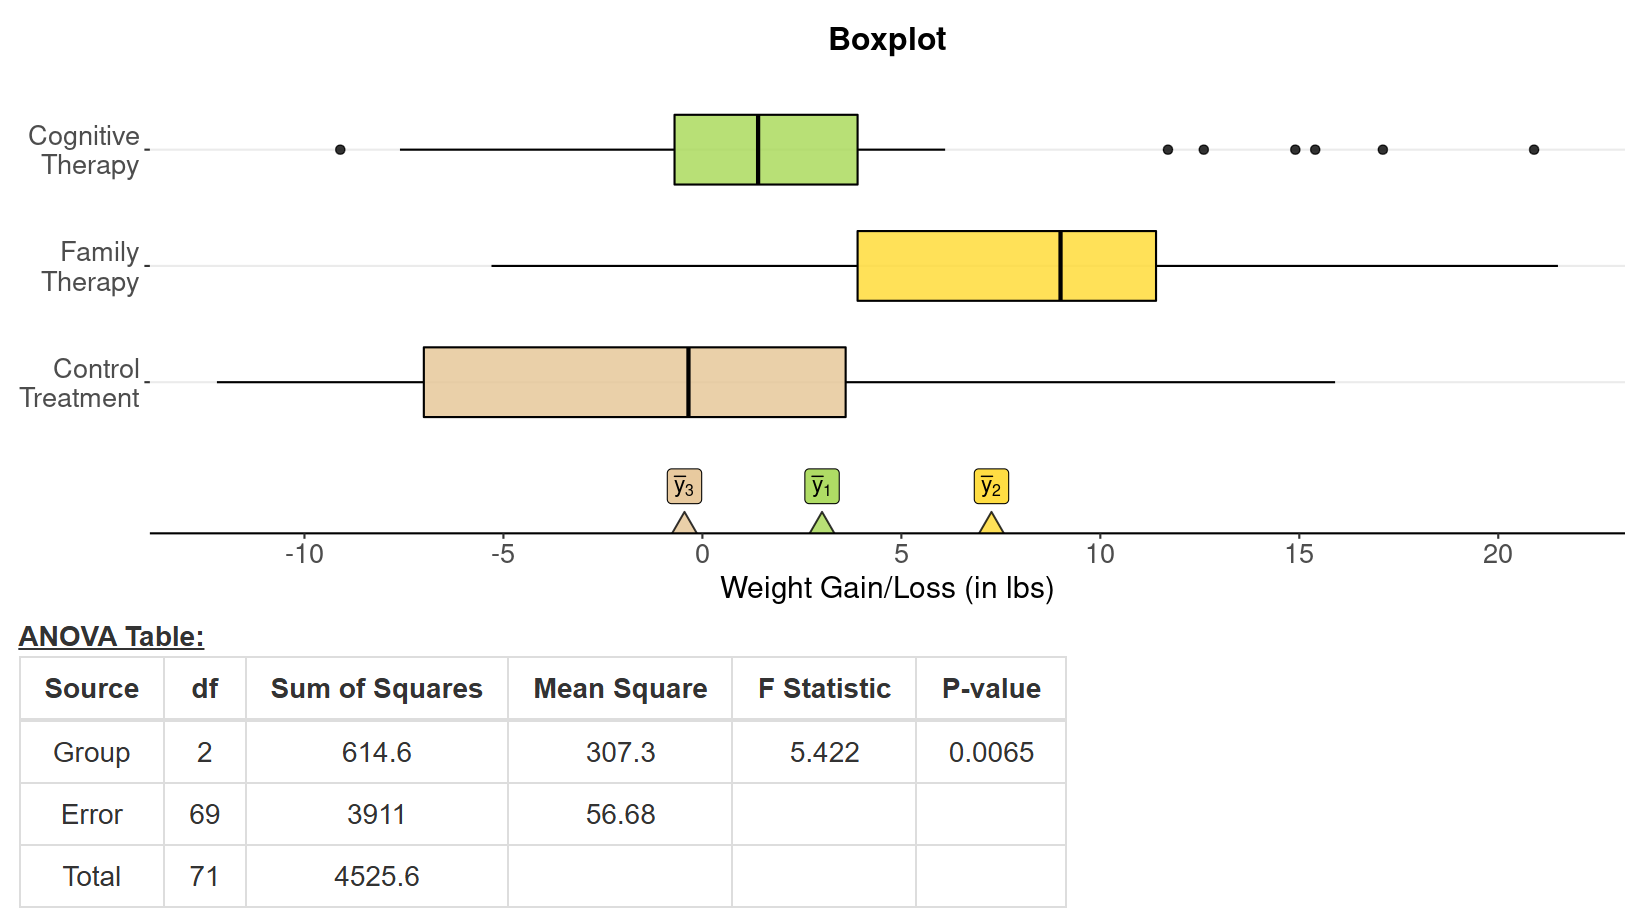
ANOVA (One-Way)
Obtain the ANOVA table, F-statistic and side-by-side boxplots to check assumptions. Carry out pairwise comparisons, including simultaneous confidence intervals for pairwise differences of means.
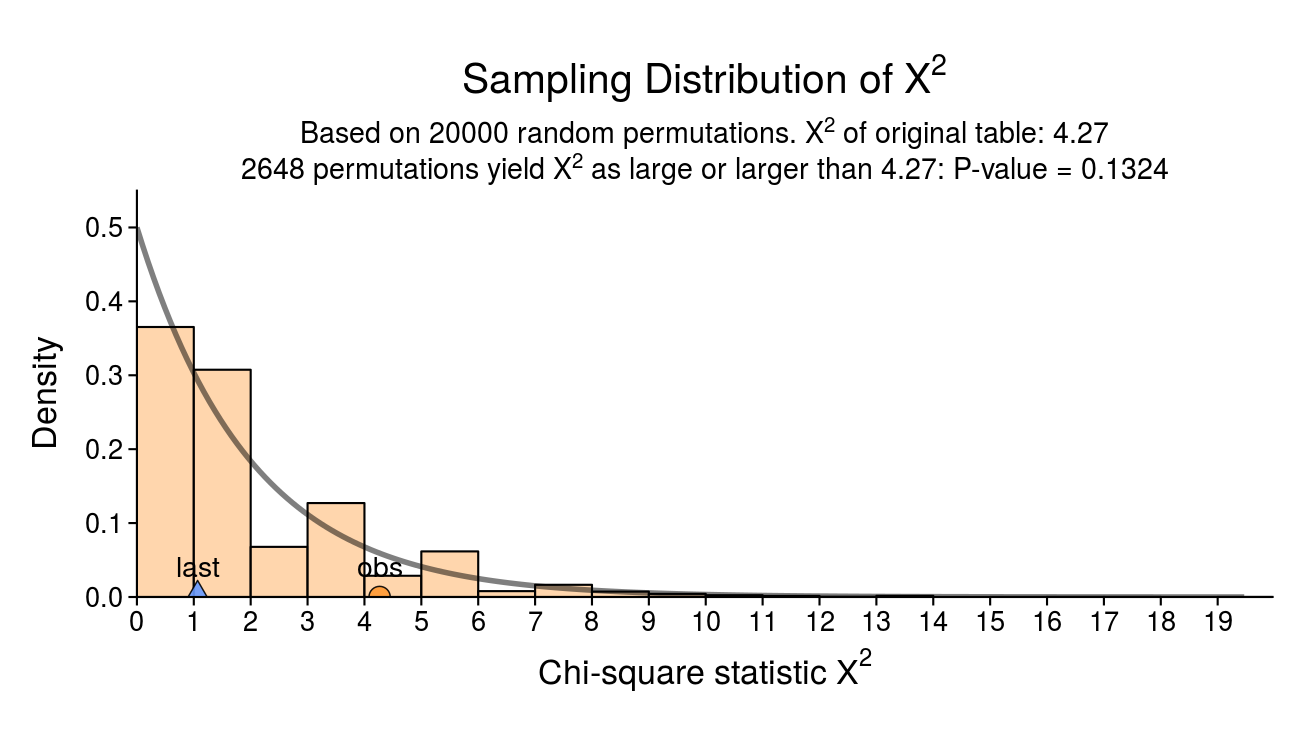
Permutation Test for Independence
Visualize and run a permutation test for testing independence in a contingency table. Obtain the permutation P-value of the Pearson Chi-squared statistic without relying on asymptotic results.
Inference on Your Phone
The Inference module of the Art of Stat mobile app (for iOS or Android) carries out the Chi-squared test or ANOVA, including all pairwise comparisons, right on your phone.